

Question: please draw the graph and explain clearly Seventh Assignment 1. Find and graph the Consumer Surplus, Producer Surplus and Total Welfare: Demand is P =

please draw the graph and explain clearly
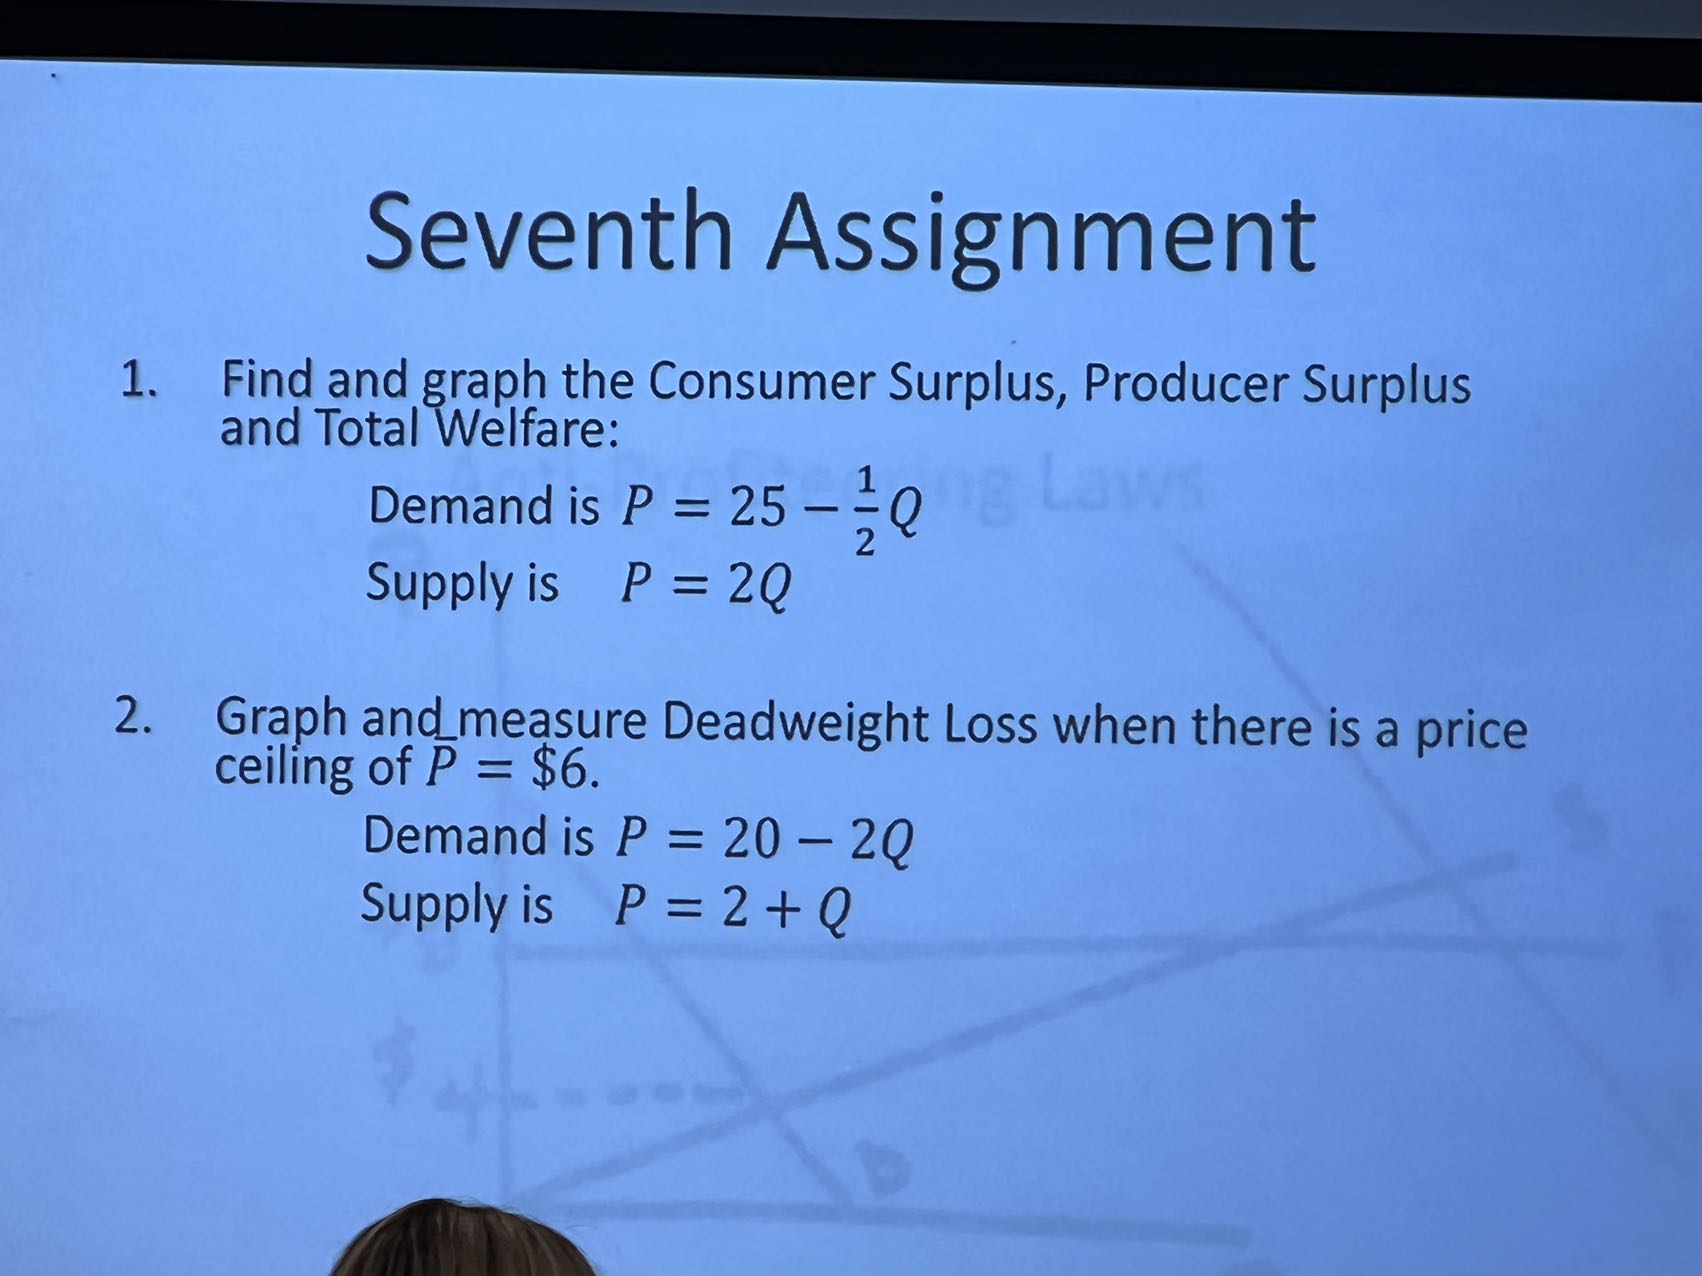
Seventh Assignment 1. Find and graph the Consumer Surplus, Producer Surplus and Total Welfare: Demand is P = 25 - = Q Laws Supply is P = 2Q 2. Graph and measure Deadweight Loss when there is a price ceiling of P = $6. Demand is P = 20 - 2Q Supply is P = 2+
Step by Step Solution
There are 3 Steps involved in it
1 Expert Approved Answer
Step: 1 Unlock

Question Has Been Solved by an Expert!
Get step-by-step solutions from verified subject matter experts
Step: 2 Unlock
Step: 3 Unlock