

Question: Please draw the graph correctly In an effort to reduce alcohol consumption, the government is considering a $1 tax on each gallon of liquor sold
Please draw the graph correctly
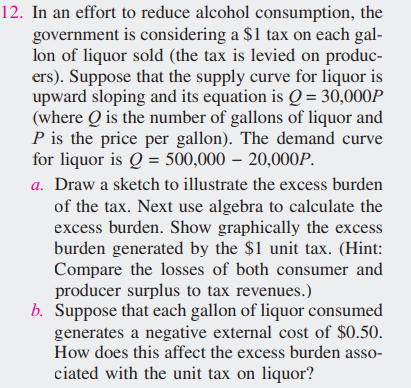
In an effort to reduce alcohol consumption, the government is considering a $1 tax on each gallon of liquor sold (the tax is levied on producers). Suppose that the supply curve for liquor is upward sloping and its equation is Q=30,000P (where Q is the number of gallons of liquor and P is the price per gallon). The demand curve for liquor is Q=500,00020,000P. a. Draw a sketch to illustrate the excess burden of the tax. Next use algebra to calculate the excess burden. Show graphically the excess burden generated by the $1 unit tax. (Hint: Compare the losses of both consumer and producer surplus to tax revenues.) b. Suppose that each gallon of liquor consumed generates a negative external cost of $0.50. How does this affect the excess burden associated with the unit tax on liquor? In an effort to reduce alcohol consumption, the government is considering a $1 tax on each gallon of liquor sold (the tax is levied on producers). Suppose that the supply curve for liquor is upward sloping and its equation is Q=30,000P (where Q is the number of gallons of liquor and P is the price per gallon). The demand curve for liquor is Q=500,00020,000P. a. Draw a sketch to illustrate the excess burden of the tax. Next use algebra to calculate the excess burden. Show graphically the excess burden generated by the $1 unit tax. (Hint: Compare the losses of both consumer and producer surplus to tax revenues.) b. Suppose that each gallon of liquor consumed generates a negative external cost of $0.50. How does this affect the excess burden associated with the unit tax on liquor
Step by Step Solution
There are 3 Steps involved in it

Get step-by-step solutions from verified subject matter experts