

Question: Please draw the histogram and label it with the numbers The heights (in inches) for a sample of 19 male adults are 62, 82, 79,
Please draw the histogram and label it with the numbers
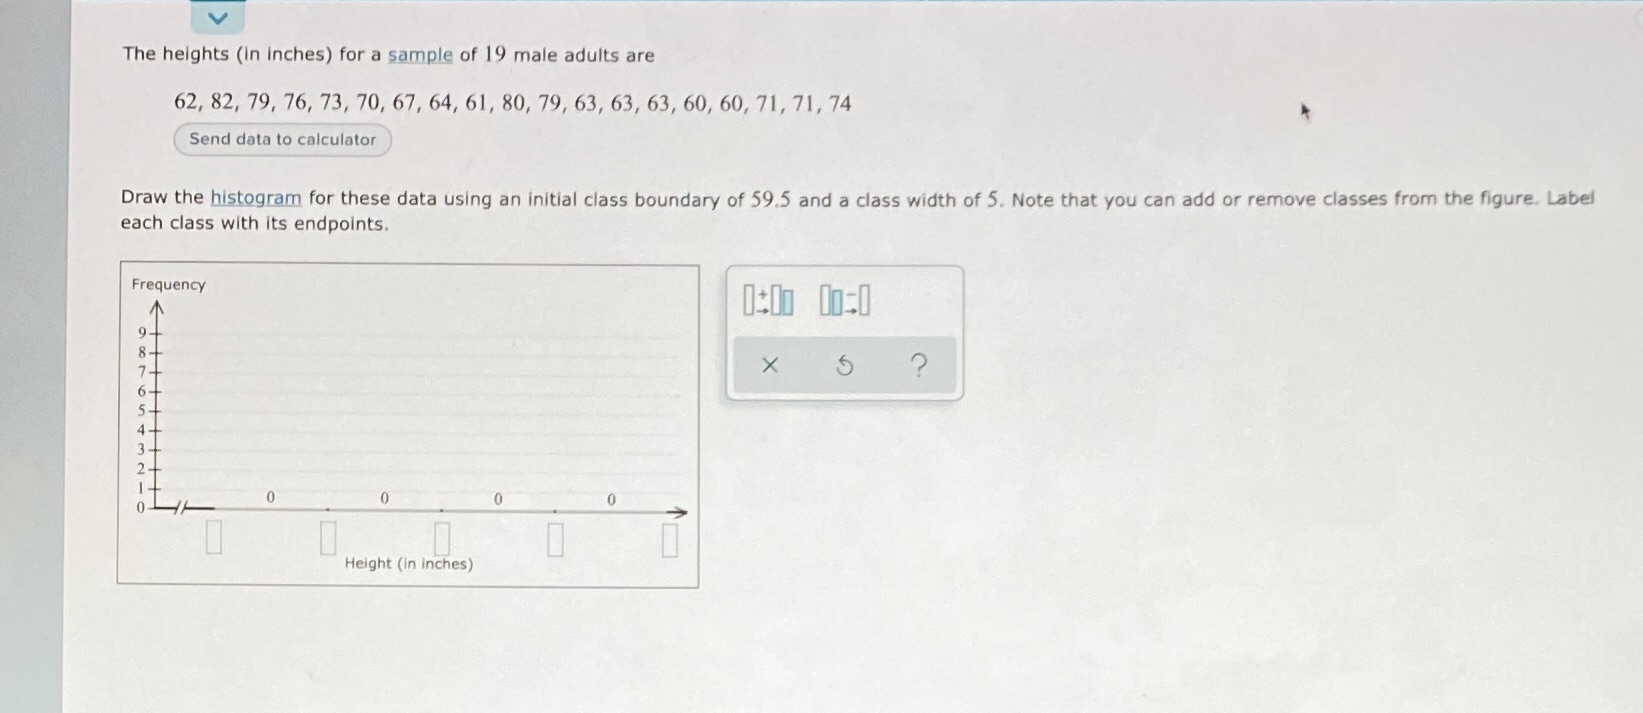
The heights (in inches) for a sample of 19 male adults are 62, 82, 79, 76, 73, 70, 67, 64, 61, 80, 79, 63, 63, 63, 60, 60, 71, 71, 74 Send data to calculator Draw the histogram for these data using an initial class boundary of 59.5 and a class width of 5. Note that you can add or remove classes from the figure. Label each class with its endpoints. Frequency 9 - X 5 ? + N 0 0 0 0 Height (in inches)
Step by Step Solution
There are 3 Steps involved in it
1 Expert Approved Answer
Step: 1 Unlock

Question Has Been Solved by an Expert!
Get step-by-step solutions from verified subject matter experts
Step: 2 Unlock
Step: 3 Unlock