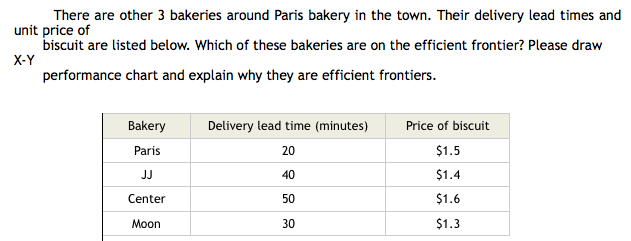
Question: Please draw X-Y GRAPH performance chart and explain why they are efficient frontiers. There are other 3 bakeries around Paris bakery in the town. Their

Please draw X-Y GRAPH performance chart and explain why they are efficient frontiers.

Please draw X-Y GRAPH performance chart and

There are other 3 bakeries around Paris bakery in the town. Their delivery lead times and unit price of biscuit are listed below. Which of these bakeries are on the efficient frontier? Please draw - X-Y performance chart and explain why they are efficient frontiers. Bakery Delivery lead time (minutes) Price of biscuit Paris $1.5 $1.4 $1.6 Center Moon $1.3

Step by Step Solution

There are 3 Steps involved in it

1 Expert Approved Answer
Step: 1 Unlock blur-text-image
Question Has Been Solved by an Expert!

Get step-by-step solutions from verified subject matter experts

Step: 2 Unlock
Step: 3 Unlock

Students Have Also Explored These Related General Management Questions!