

Question: ***Please either give a complete answer to all parts with plot on computer OR skip my question*** ***Please either give a complete answer to all
***Please either give a complete answer to all parts with plot on computer OR skip my question***
***Please either give a complete answer to all parts with plot on computer OR skip my question***
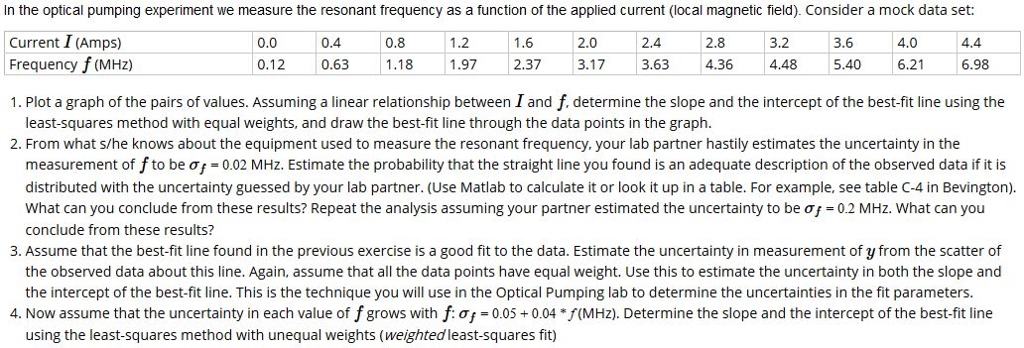
In the optical pumping experiment we measure the resonant frequency as a function of the applied current (local magnetic field). Consider a mock data set: Current I (Amps) Frequency f (MHz) 1. Plot a graph of the pairs of values. Assuming a linear relationship between I and f. determine the slope and the intercept of the best-fit line using the 2. From what s/he knows about the equipment used to measure the resonant frequency. your lab partner hastily estimates the uncertainty in the 0.0 0.4 0.8 12.6 2.02.42.8 3.2 3.6 4.0 4.4 0.12 0.63 1.18 1.97 2.37 3.17 3.63 4.36 4.48 5.40 6.21 6.98 least-squares method with equal weights, and draw the best-fit line through the data points in the graph. measurement of f to be 0.02 MHz. Estimate the probability that the straight line you found is an adequate description of the observed data if it is distributed with the uncertainty guessed by your lab partner. (Use Matlab to calculate it or look it up in a table. For example, see table C-4 in Bevington). what can you conclude from these results? Repeat the analysis assuming your partner estimated the uncertainty to be 0.2 MHz. What can you conclude from these results? 3. Assume that the best-fit line found in the previous exercise is a good fit to the data. Estimate the uncertainty in measurement of y from the scatter of the observed data about this line. Again, assume that all the data points have equal weight. Use this to estimate the uncertainty in both the slope and the intercept of the best-fit line. This is the technique you will use in the Optical Pumping lab to determine the uncertainties in the fit parameters. 4. Now assume that the uncertainty in each value of f grows with f.cf-0.05+ 0.04 *f(MHz). Determine the slope and the intercept of the best-fit line using the least-squares method with unequal weights (weighted least-squares fit) In the optical pumping experiment we measure the resonant frequency as a function of the applied current (local magnetic field). Consider a mock data set: Current I (Amps) Frequency f (MHz) 1. Plot a graph of the pairs of values. Assuming a linear relationship between I and f. determine the slope and the intercept of the best-fit line using the 2. From what s/he knows about the equipment used to measure the resonant frequency. your lab partner hastily estimates the uncertainty in the 0.0 0.4 0.8 12.6 2.02.42.8 3.2 3.6 4.0 4.4 0.12 0.63 1.18 1.97 2.37 3.17 3.63 4.36 4.48 5.40 6.21 6.98 least-squares method with equal weights, and draw the best-fit line through the data points in the graph. measurement of f to be 0.02 MHz. Estimate the probability that the straight line you found is an adequate description of the observed data if it is distributed with the uncertainty guessed by your lab partner. (Use Matlab to calculate it or look it up in a table. For example, see table C-4 in Bevington). what can you conclude from these results? Repeat the analysis assuming your partner estimated the uncertainty to be 0.2 MHz. What can you conclude from these results? 3. Assume that the best-fit line found in the previous exercise is a good fit to the data. Estimate the uncertainty in measurement of y from the scatter of the observed data about this line. Again, assume that all the data points have equal weight. Use this to estimate the uncertainty in both the slope and the intercept of the best-fit line. This is the technique you will use in the Optical Pumping lab to determine the uncertainties in the fit parameters. 4. Now assume that the uncertainty in each value of f grows with f.cf-0.05+ 0.04 *f(MHz). Determine the slope and the intercept of the best-fit line using the least-squares method with unequal weights (weighted least-squares fit)
Step by Step Solution
There are 3 Steps involved in it

Get step-by-step solutions from verified subject matter experts