

Question: please emergency !!! (25 points total) in the Excel file that is linked to this question, you will see the stock prices for 2 different
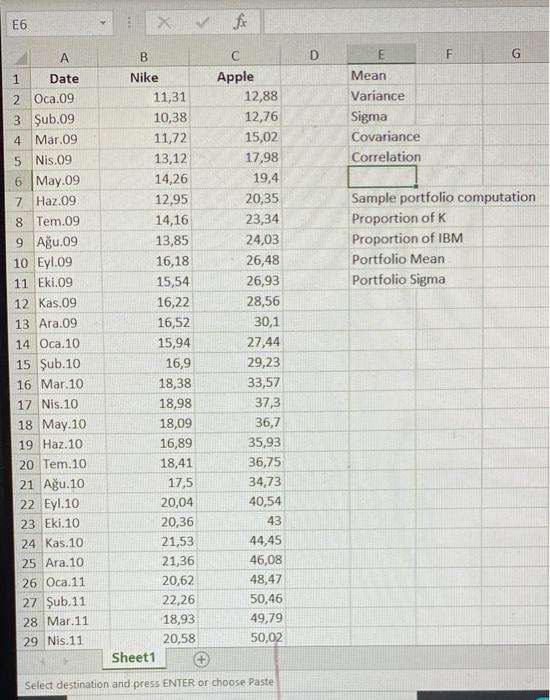
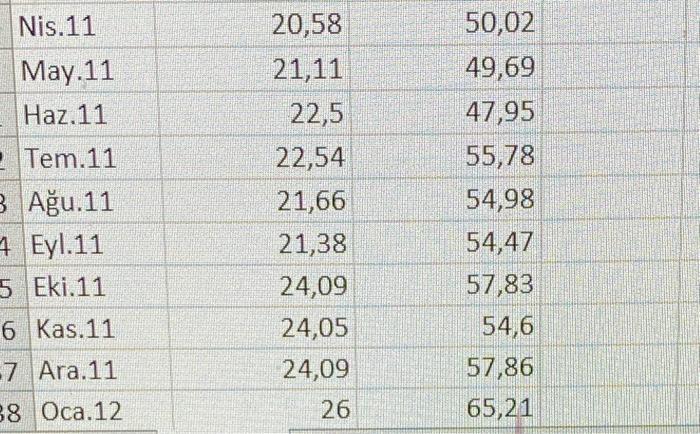
(25 points total) in the Excel file that is linked to this question, you will see the stock prices for 2 different stocks. a) (5 points) Please calculate the Mean Variance, Standard Deviation Covariance and Correlation for your two stock returns. b) (5 points) Assume that you have a hypothetical portfolio of 30% (stock 1) and 70% (stock 2). Calculate the portfolio mean retum and standard deviation of this portfolio. (5 points) Vary the proportions of your stock i between 1 and +1 (increments of 0.1) and create a data table for portfolio means and standard deviations for the different weights used di) (5 points) Draw a graph of portfolio standard deviations and mean returns using the different values you found in the dala table. e) (5 points) Describe/Explain what the graph shows us with your own words Link to file E6 B C D E F G Mean Variance Sigma Covariance Correlation Sample portfolio computation Proportion of K Proportion of IBM Portfolio Mean Portfolio Sigma 1 Date 2 Oca.09 3 ub.09 4 Mar.09 5 Nis.09 6 May.09 7 Haz.09 8 Tem.09 9 Au.09 10 Eyl.09 11 Eki.09 12 Kas.09 13 Ara.09 14 Oca. 10 15 ub.10 16 Mar.10 17 Nis.10 18 May.10 19 Haz.10 20 Tem.10 21 Au.10 22 Eyl.10 23 Eki.10 24 Kas.10 25 Ara. 10 26 Oca. 11 27 ub.11 28 Mar.11 29 Nis. 11 Nike 11,31 10,38 11,72 13,12 14,26 12,95 14,16 13,85 16,18 15,54 16,22 16,52 15,94 16,9 18,38 18,98 18,09 16,89 18,41 17,5 20,04 20,36 21,53 21,36 20,62 22,26 18,93 20,58 Sheet1 Apple 12,88 12,76 15,02 17,98 19,4 20,35 23,34 24,03 26,48 26,93 28,56 30,1 27,44 29,23 33,57 37,3 36,7 35,93 36,75 34,73 40,54 43 44,45 46,08 48,47 50,46 49,79 50,02 Select destination and press ENTER or choose Paste Nis. 11 May.11 Haz.11 Tem. 11 3 Au.11 4 Eyl.11 5 Eki.11 20,58 21,11 22,5 22,54 21,66 21,38 24,09 24,05 24,09 26 50,02 49,69 47,95 55,78 54,98 54,47 57,83 54,6 57,86 6 Kas.11 7 Ara.11 88 Oca.12 65,21 (25 points total) in the Excel file that is linked to this question, you will see the stock prices for 2 different stocks. a) (5 points) Please calculate the Mean Variance, Standard Deviation Covariance and Correlation for your two stock returns. b) (5 points) Assume that you have a hypothetical portfolio of 30% (stock 1) and 70% (stock 2). Calculate the portfolio mean retum and standard deviation of this portfolio. (5 points) Vary the proportions of your stock i between 1 and +1 (increments of 0.1) and create a data table for portfolio means and standard deviations for the different weights used di) (5 points) Draw a graph of portfolio standard deviations and mean returns using the different values you found in the dala table. e) (5 points) Describe/Explain what the graph shows us with your own words Link to file E6 B C D E F G Mean Variance Sigma Covariance Correlation Sample portfolio computation Proportion of K Proportion of IBM Portfolio Mean Portfolio Sigma 1 Date 2 Oca.09 3 ub.09 4 Mar.09 5 Nis.09 6 May.09 7 Haz.09 8 Tem.09 9 Au.09 10 Eyl.09 11 Eki.09 12 Kas.09 13 Ara.09 14 Oca. 10 15 ub.10 16 Mar.10 17 Nis.10 18 May.10 19 Haz.10 20 Tem.10 21 Au.10 22 Eyl.10 23 Eki.10 24 Kas.10 25 Ara. 10 26 Oca. 11 27 ub.11 28 Mar.11 29 Nis. 11 Nike 11,31 10,38 11,72 13,12 14,26 12,95 14,16 13,85 16,18 15,54 16,22 16,52 15,94 16,9 18,38 18,98 18,09 16,89 18,41 17,5 20,04 20,36 21,53 21,36 20,62 22,26 18,93 20,58 Sheet1 Apple 12,88 12,76 15,02 17,98 19,4 20,35 23,34 24,03 26,48 26,93 28,56 30,1 27,44 29,23 33,57 37,3 36,7 35,93 36,75 34,73 40,54 43 44,45 46,08 48,47 50,46 49,79 50,02 Select destination and press ENTER or choose Paste Nis. 11 May.11 Haz.11 Tem. 11 3 Au.11 4 Eyl.11 5 Eki.11 20,58 21,11 22,5 22,54 21,66 21,38 24,09 24,05 24,09 26 50,02 49,69 47,95 55,78 54,98 54,47 57,83 54,6 57,86 6 Kas.11 7 Ara.11 88 Oca.12 65,21
Step by Step Solution
There are 3 Steps involved in it

Get step-by-step solutions from verified subject matter experts