

Question: please evaluate and explain the table given above ? general analysis of the table Business Plan Y2 to Actual Y2 Variance Business Y2 Actual Y2
 please evaluate and explain the table given above ?
general analysis of the table
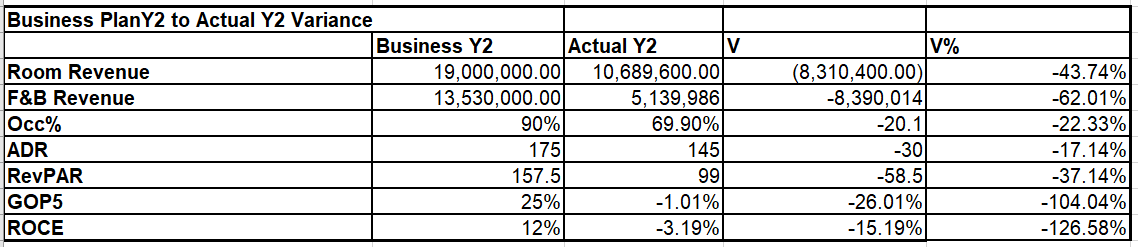
Business Plan Y2 to Actual Y2 Variance Business Y2 Actual Y2 V Room Revenue 19,000,000.00 10,689,600.00 F&B Revenue 13,530,000.00 5,139,986 Occ% 90% 69.90% ADR 175) 145 RevPAR 157.5 99 GOP5 25% -1.01% ROCE 12% -3.19% V% (8,310,400.00) -8,390,014 -20.1 -30 -58.5 -26.01% -15.19% -43.74% -62.01% -22.33% -17.14% -37.14% -104.04% -126.58%Step by Step Solution
There are 3 Steps involved in it
1 Expert Approved Answer
Step: 1 Unlock

Question Has Been Solved by an Expert!
Get step-by-step solutions from verified subject matter experts
Step: 2 Unlock
Step: 3 Unlock