

Question: please expert help me to run this code using python in Jupyterlab, and I don't know why I cannot run it, thanks Example: The Iris
please expert help me to run this code using python in Jupyterlab, and I don't know why I cannot run it, thanks
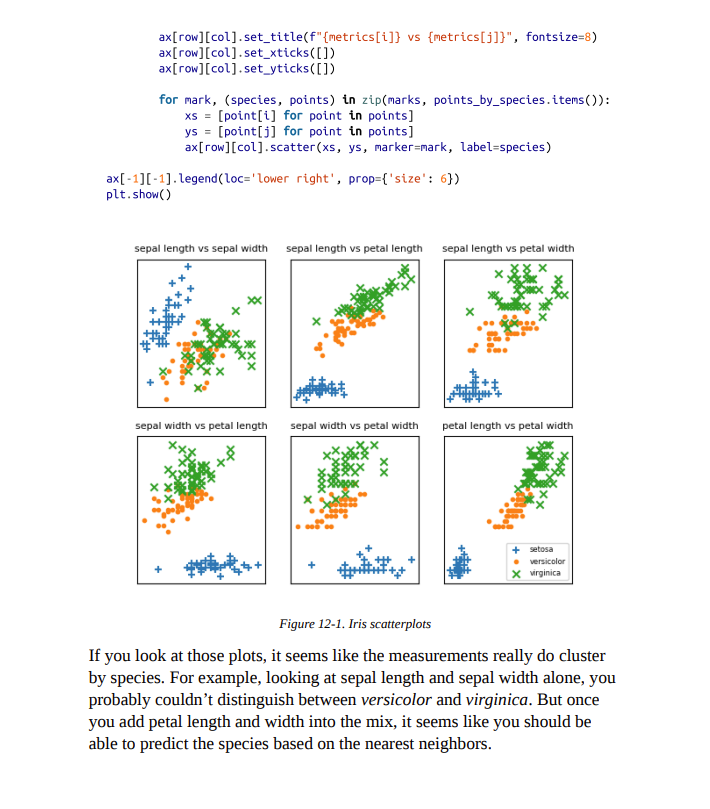
Example: The Iris Dataset The Iris dataset is a staple of machine learning. It contains a bunch of measurements for 150 flowers representing three species of iris. For each flower we have its petal length, petal width, sepal length, and sepal width, as well as its species. You can download it from https://archive.ics.uci.edu/ml/datasets/iris: import requests data = requests.get "https://archive.ics. uci.edu/ml/machine-learning-databases/iris/iris.data" ) with open('iris.dat' , 'w') as f: f.write(data.text) The data is comma-separated, with fields: sepal_length, sepal_width, petal_length, petal_width, class For example, the first row looks like: 5.1,3.5,1.4,0.2, Iris-setosa In this section we'll try to build a model that can predict the class (that is, the species) from the first four measurements. To start with, let's load and explore the data. Our nearest neighbors function expects a LabeledPoint, so let's represent our data that way: from typing import Dict import csv from collections import defaultdict def parse_iris_row(row: List[str]) -> LabeledPoint: sepal_length, sepal_width, petal_length, petal_width, class measurements = [float(value) for value in row[:-1]] \# class is e.g. "Iris-virginica"; we just want "virginica" label = row[-1].split("-")[-1] return Labeledpoint(measurements, label) with open('iris.data') as f: reader = csv_reader(f) iris_data = [parse_iris_row(row) for row in reader] \# We'llalso group just the points by species/label so we can plot them points_by_species: Dict[str, List[Vector]] = defaultdict(list) for iris in iris_data: points_by_species[iris.label]. append(iris.point) We'd like to plot the measurements so we can see how they vary by species. Unfortunately, they are four-dimensional, which makes them tricky to plot. One thing we can do is look at the scatterplots for each of the six pairs of measurements (Figure 12-1). I won't explain all the details, but it's a nice illustration of more complicated things you can do with matplotlib, so it's worth studying: from matplotlib import pyplot as plt metrics = ['sepal length', 'sepal width', 'petal length', 'petal width'] pairs =[(i,j) for i in range(4) for j in range(4) if i
Step by Step Solution
There are 3 Steps involved in it
To run the code provided for processing the Iris dataset in JupyterLab youll need to fix some issues and ensure everything is set up correctly Heres a ... View full answer

Get step-by-step solutions from verified subject matter experts