

Question: Please explain and help solve. 2. In Fig. 6.e2a we are given the spatial arrangement of 7 data points together with the corresponding data values,
Please explain and help solve.
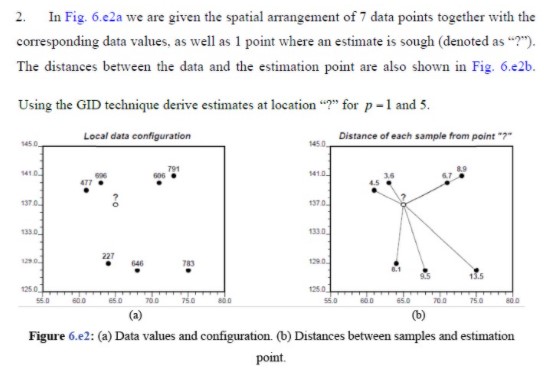
2. In Fig. 6.e2a we are given the spatial arrangement of 7 data points together with the corresponding data values, as well as 1 point where an estimate is sough (denoted as "?"). The distances between the data and the estimation point are also shown in Fig. 6.e2b. Using the GID technique derive estimates at location "?" for p -1 and 5. Local data configuration Distance of each sample from point "?" 1450 145 0 791 ET ATT 1370 135 0 1310 227 12510 56.0 60 0 TOO 750 56.0 8510 7010 750 (a) (b) Figure 6.e2: (a) Data values and configuration. (b) Distances between samples and estimation point
Step by Step Solution
There are 3 Steps involved in it
1 Expert Approved Answer
Step: 1 Unlock

Question Has Been Solved by an Expert!
Get step-by-step solutions from verified subject matter experts
Step: 2 Unlock
Step: 3 Unlock