

Question: Please explain and help solve by referring to the information below. In Fig. 6.e2a we are given the spatial arrangement of 7 data points together
Please explain and help solve by referring to the information below.
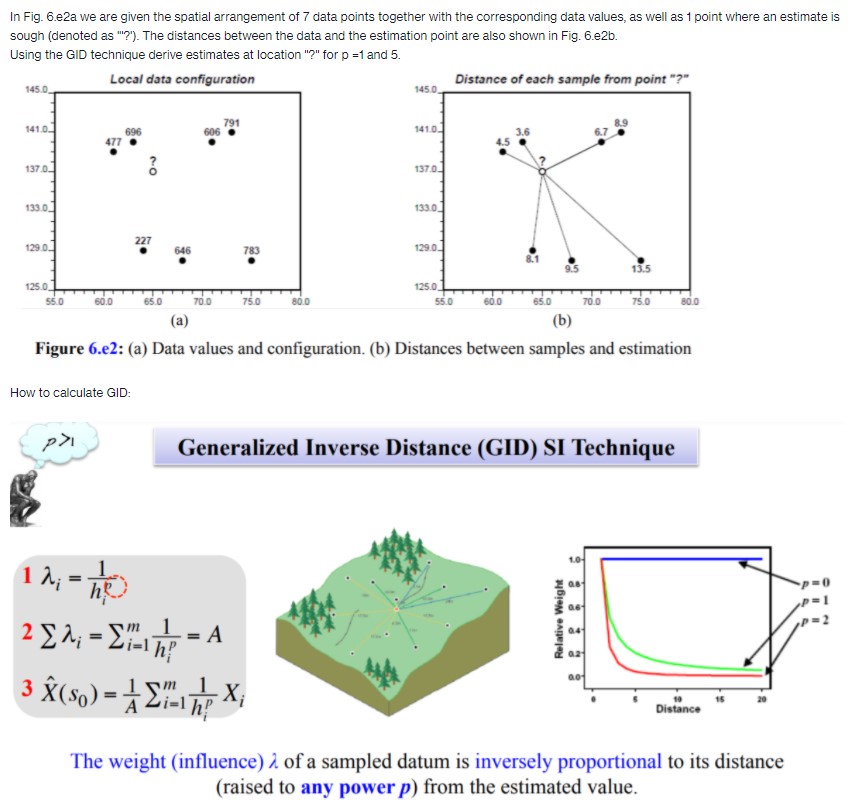
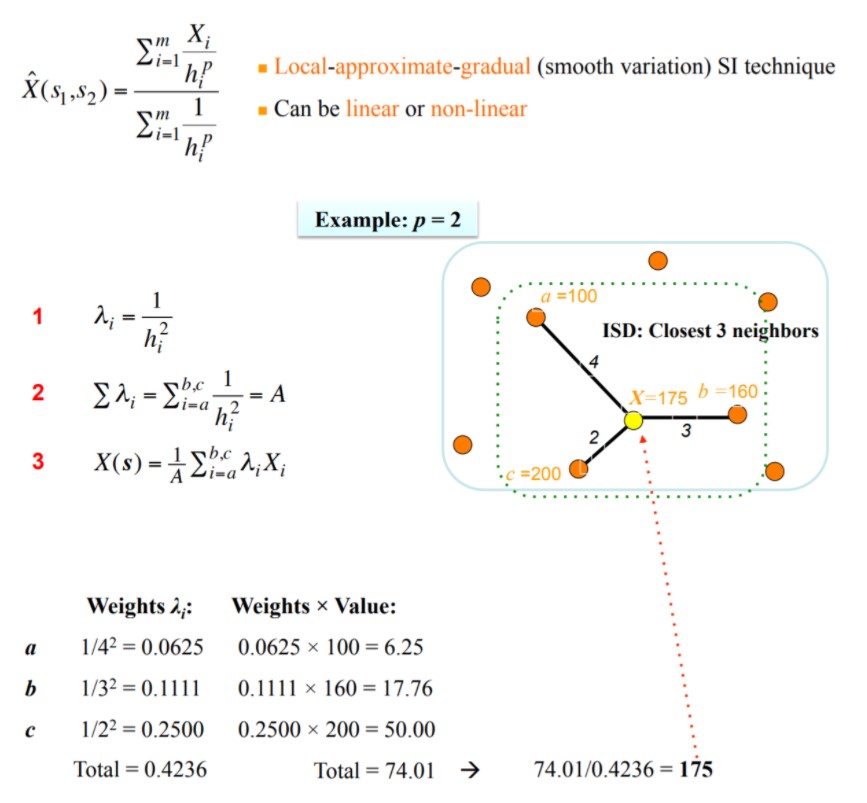
In Fig. 6.e2a we are given the spatial arrangement of 7 data points together with the corresponding data values, as well as 1 point where an estimate is sough (denoted as "?"). The distances between the data and the estimation point are also shown in Fig. 6.e2b. Using the GID technique derive estimates at location "?" for p =1 and 5. Local data configuration Distance of each sample from point "?" 145.0 145.0 141.0 791 69 606 141.0 177 137 0_ 137.0 133.0 133.0 129 0 227 646 783 129 0_ 95 13.5 125.0_ 125.0_ 55.0 60.0 65.0 70.0 75.0 55.0 60.0 65.0 70.D 75.0 80.0 (a) (b) Figure 6.e2: (a) Data values and configuration. (b) Distances between samples and estimation How to calculate GID: Generalized Inverse Distance (GID) SI Technique 1 1 = TO Relative Weight 3 X (s ) = 1\\m IX; Distance The weight (influence) 1 of a sampled datum is inversely proportional to its distance (raised to any power p) from the estimated value.X; Zi=1 . Local-approximate-gradual (smooth variation) SI technique X (S ] , 52 ) = h! Sm 1 . Can be linear or non-linear Zi=1 h! Example: p = 2 a =100 1 A = ISD: Closest 3 neighbors 4 be 1 2 En; = Zi=ah? - = A X=175 6 =160 : 2 3 3 X(s) = 1Ebc AX; C =200 Weights 1;: Weights x Value: a 1/42 = 0.0625 0.0625 x 100 = 6.25 b 1/32 = 0.1111 0.1111 x 160 = 17.76 C 1/22 = 0.2500 0.2500 x 200 = 50.00 Total = 0.4236 Total = 74.01 74.01/0.4236 = 175
Step by Step Solution
There are 3 Steps involved in it

Get step-by-step solutions from verified subject matter experts