

Question: Please explain answer and steps graphs of M and W illustrate the life expectancyes for men, M, and women, W, in the United States based
Please explain answer and steps
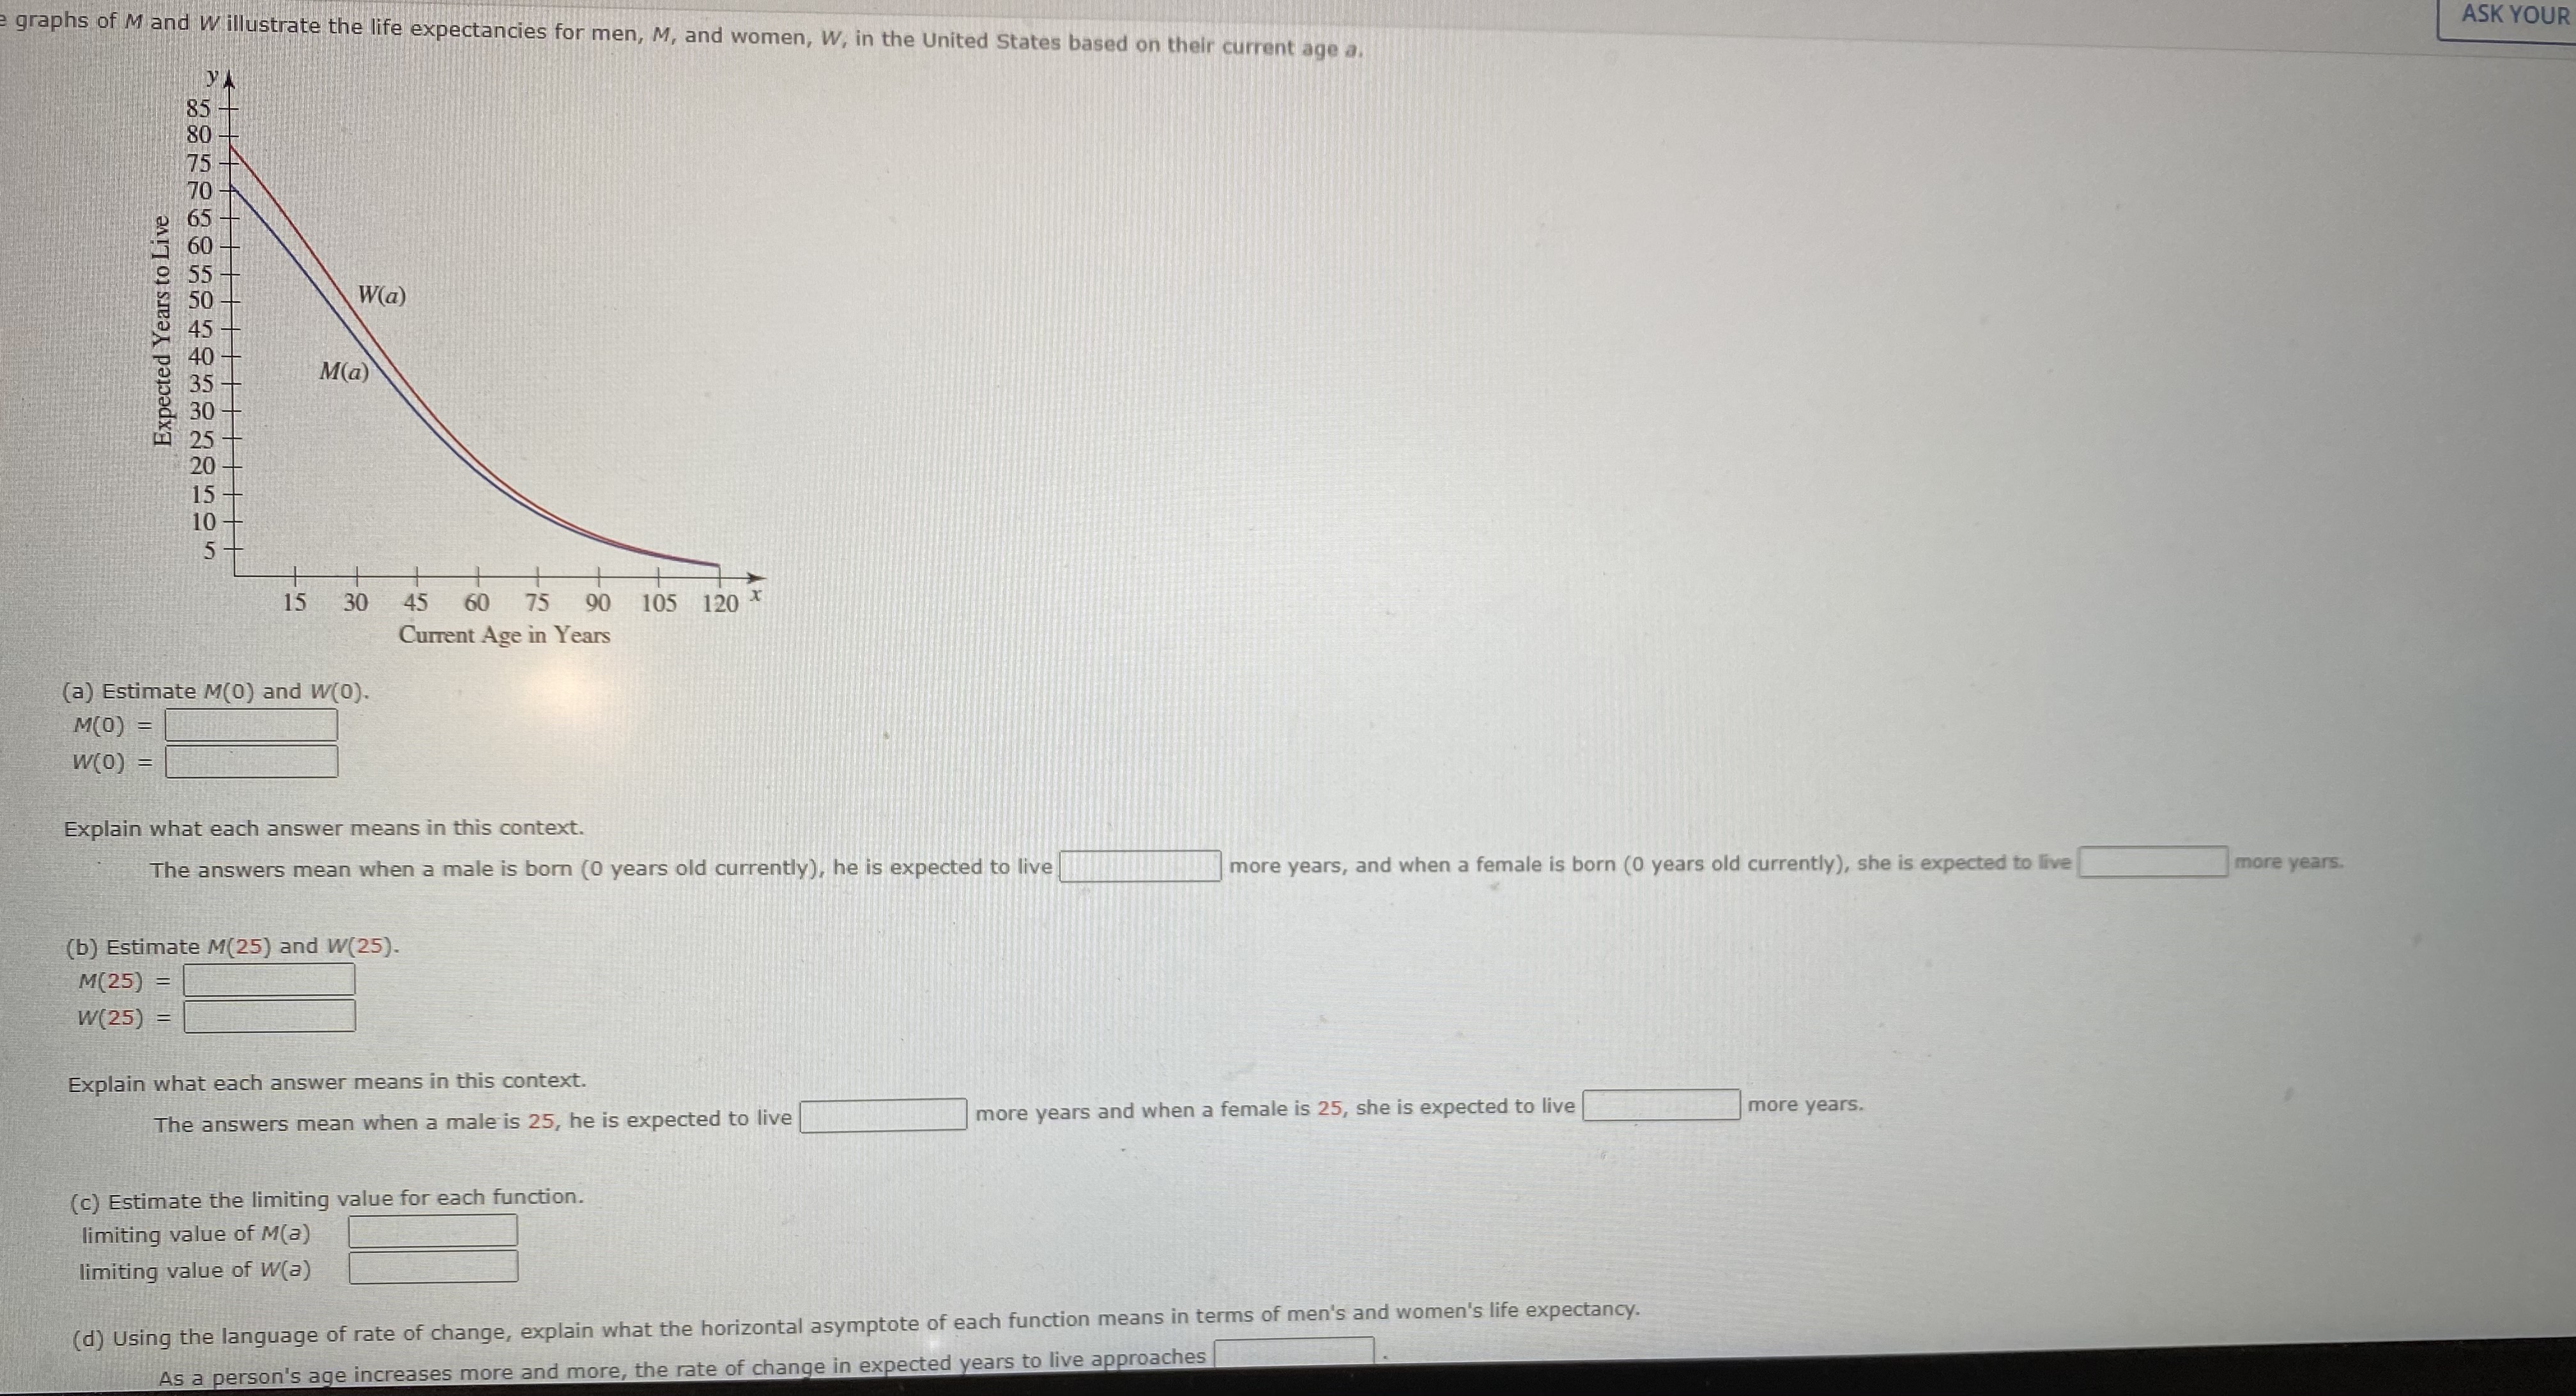
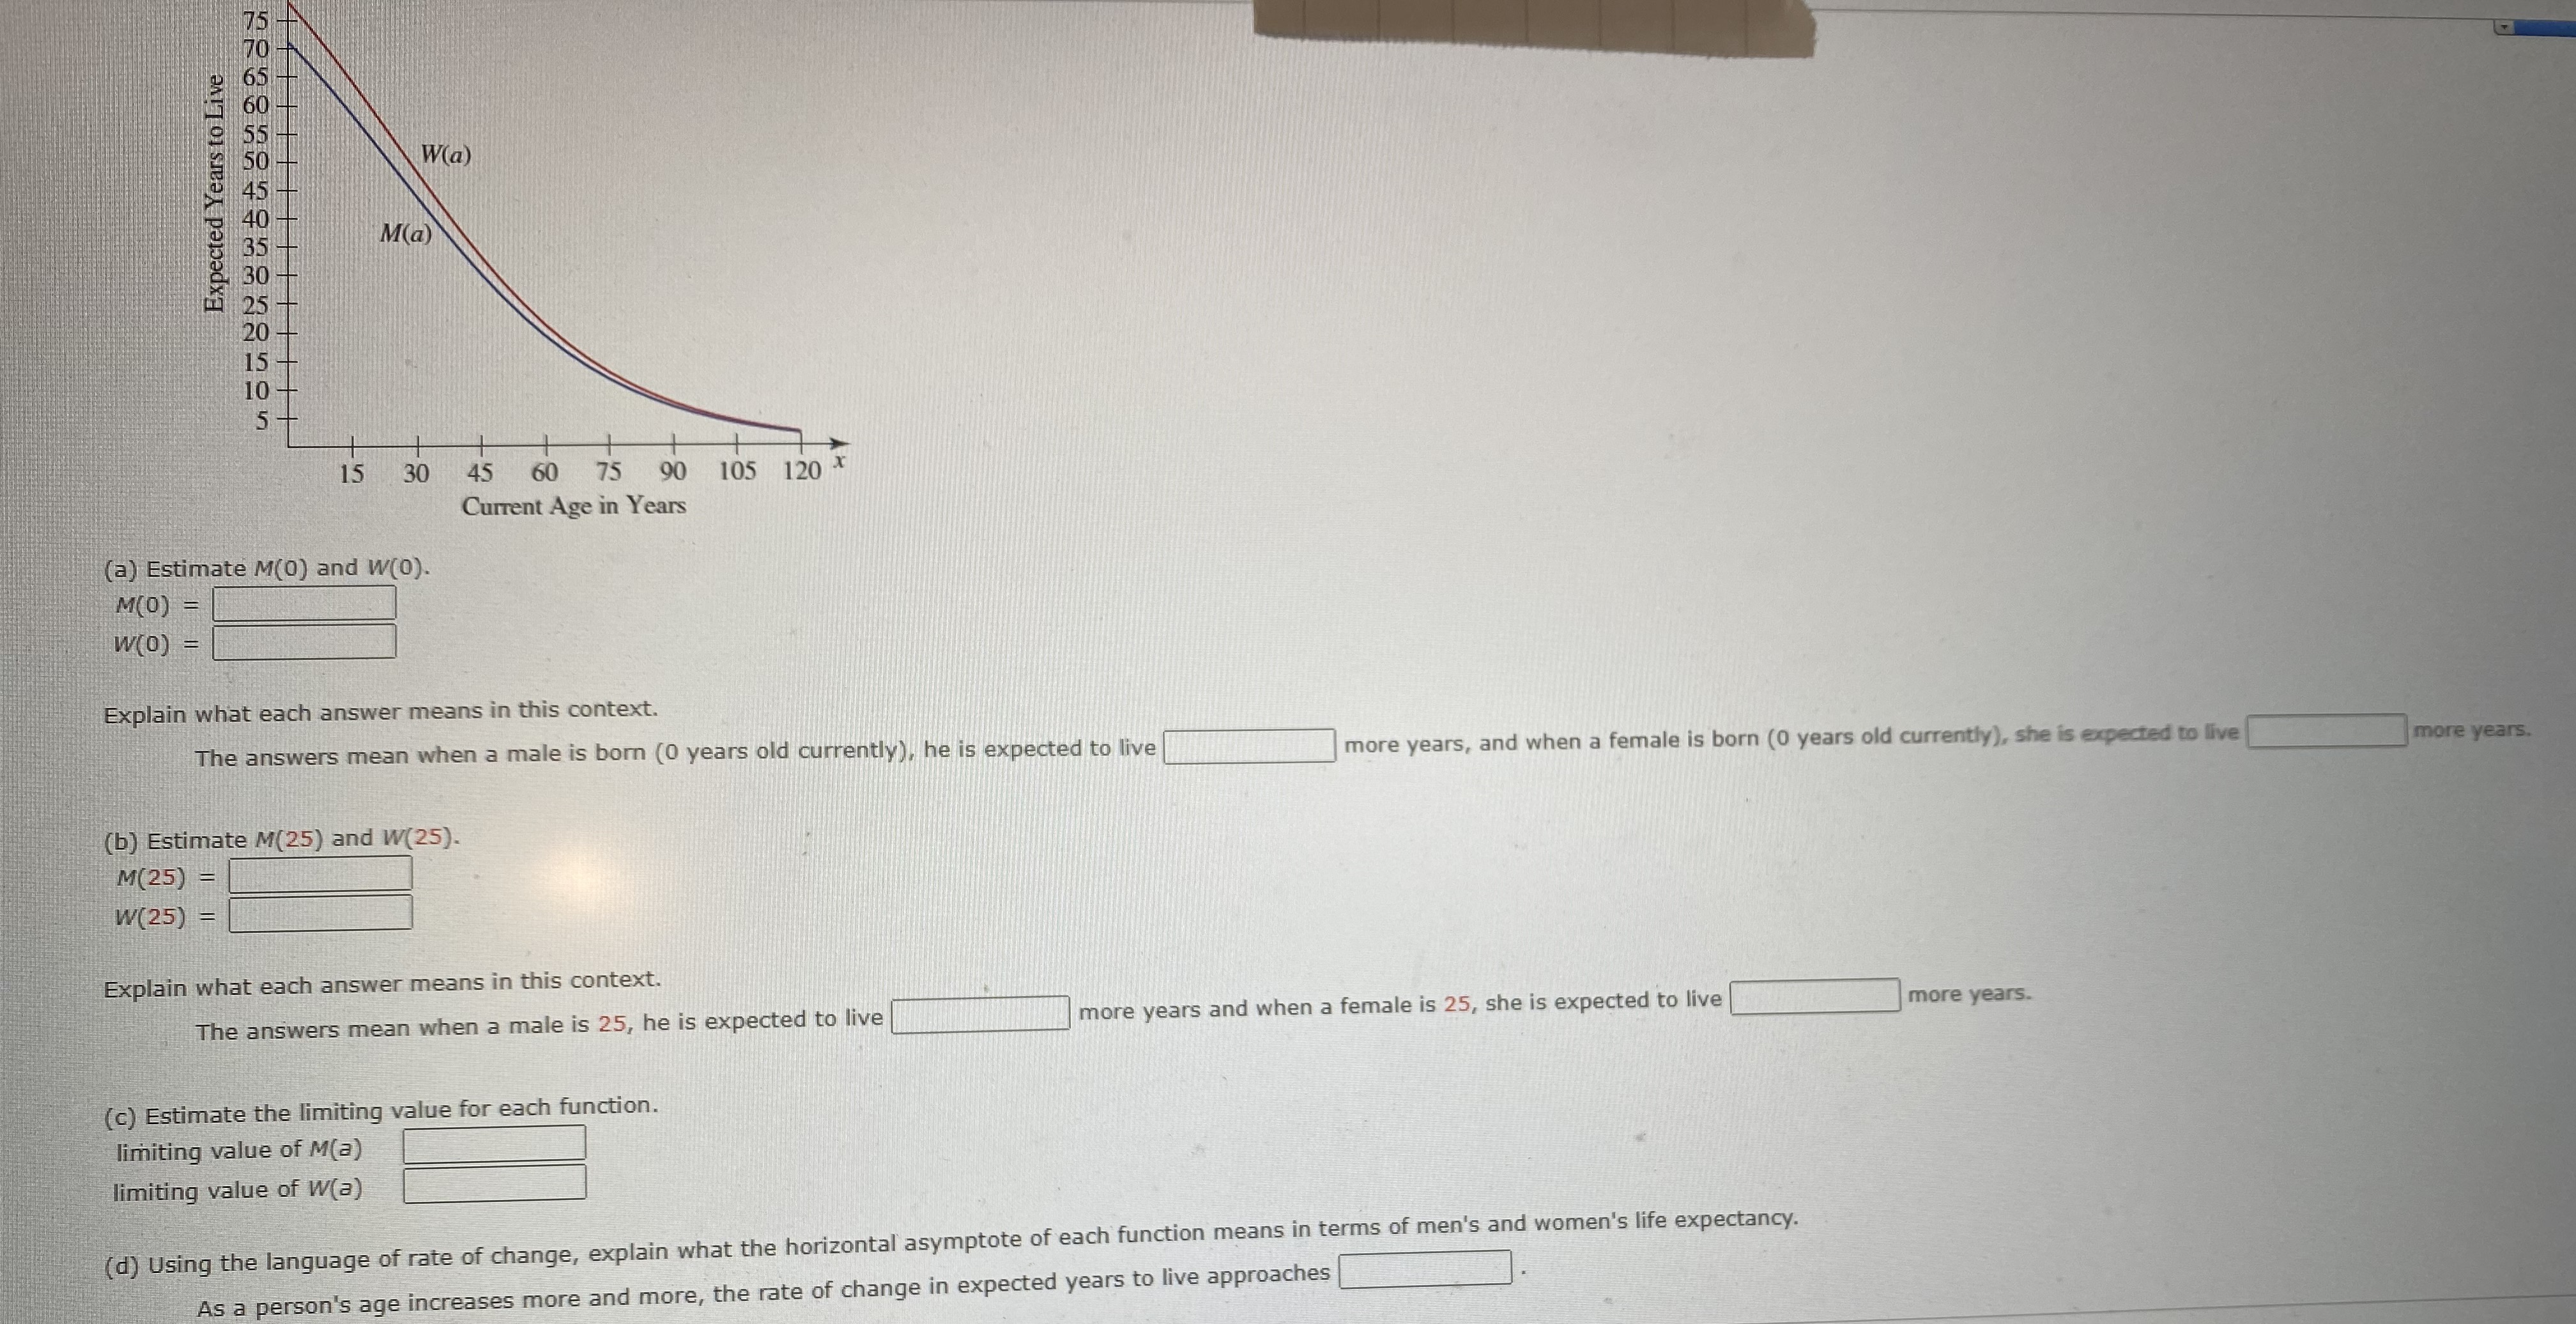
graphs of M and W illustrate the life expectancyes for men, M, and women, W, in the United States based on their current age a. ASK YOUR 85 - 80 75 70 W(a) Expected Years to Live M(a) 15 15 30 45 60 75 90 105 120 X Current Age in Years (a) Estimate M(0) and W(0). M(0) = W(0) = Explain what each answer means in this context. The answers mean when a male is born (0 years old currently), he is expected to live more years, and when a female is born (0 years old currently), she is expected to live more years. (b) Estimate M(25) and W(25). M(25) = W(25 ) = Explain what each answer means in this context. The answers mean when a male is 25, he is expected to live more years and when a female is 25, she is expected to live more years. (c) Estimate the limiting value for each function. limiting value of M(a) limiting value of W(a) (d) Using the language of rate of change, explain what the horizontal asymptote of each function means in terms of men's and women's life expectancy. As a person's age increases more and more, the rate of change in expected years to live approachesW(a) Expected Years to Live M(a) 15 30 45 60 75 90 105 120 X Current Age in Years (a) Estimate M(0) and W(0). M(0) = W(0) = Explain what each answer means in this context. The answers mean when a male is born (0 years old currently), he is expected to live more years, and when a female is born (0 years old currently), she is expected to live more years. (b) Estimate M(25) and W(25). M(25 ) = W (25 ) = Explain what each answer means in this context. The answers mean when a male is 25, he is expected to live more years and when a female is 25, she is expected to live more years. (c) Estimate the limiting value for each function. limiting value of M(a) limiting value of W(a) (d) Using the language of rate of change, explain what the horizontal asymptote of each function means in terms of men's and women's life expectancy. As a person's age increases more and more, the rate of change in expected years to live approaches
Step by Step Solution
There are 3 Steps involved in it

Get step-by-step solutions from verified subject matter experts