

Question: Please explain briefly. Thanks 4. Asymptotic analysis: Visually Submit your answers here: https://canvas.uw.edu/courses/1219673/assignments/4468678 For each of the following plots, provide a tight big-O bound, a
Please explain briefly. Thanks
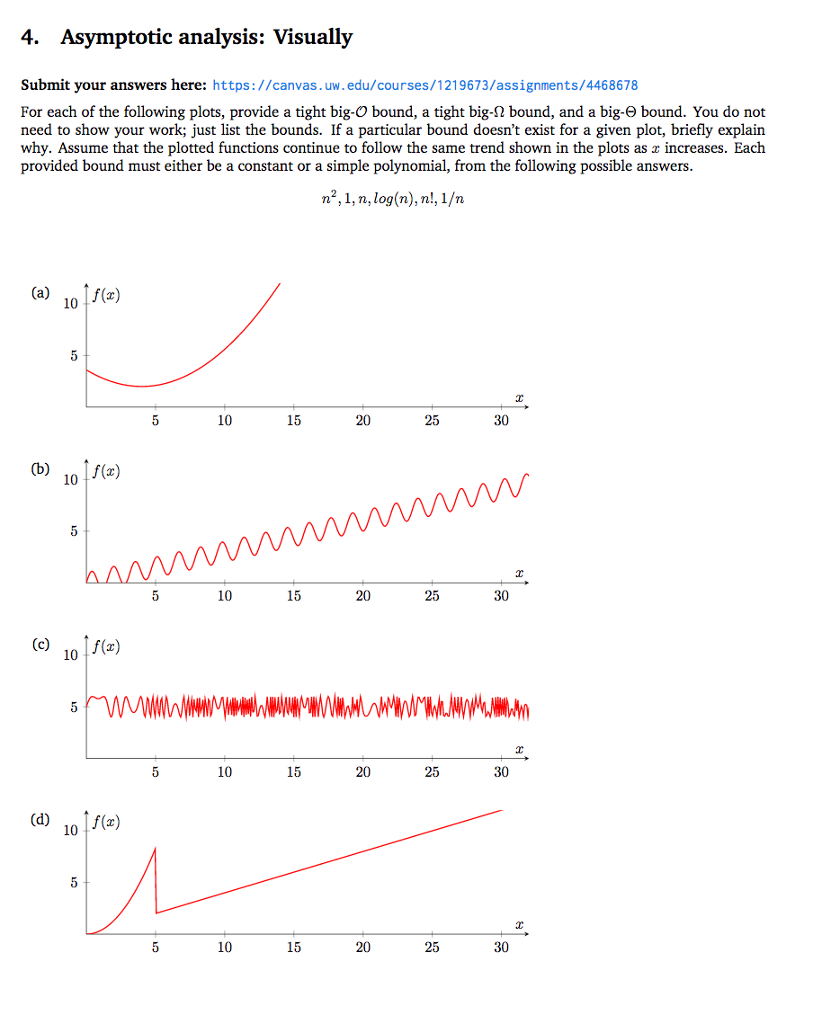
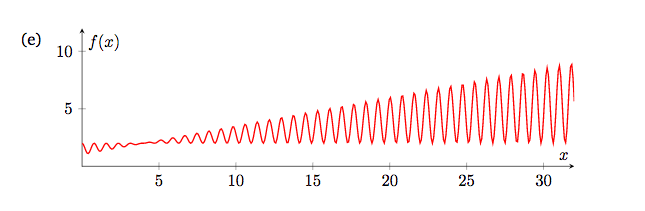
4. Asymptotic analysis: Visually Submit your answers here: https://canvas.uw.edu/courses/1219673/assignments/4468678 For each of the following plots, provide a tight big-O bound, a tight big-2 bound, and a big-0 bound. You do not need to show your work; just list the bounds. If a particular bound doesn't exist for a given plot, briefly explain why. Assume that the plotted functions continue to follow the same trend shown in the plots as increases. Each provided bound must either be a constant or a simple polynomial, from the following possible answers n2 , 1, n, log(n), n l, 1/m (a) 10() 10 15 20 25 30 10 10 15 20 30 (e) 10f) 10 15 20 30 (d) f(a) 10 10 15 20 25 30
Step by Step Solution
There are 3 Steps involved in it

Get step-by-step solutions from verified subject matter experts