

Question: Q 1 ) ( 2 0 pts ) Asymptotic analysis: visually For each of the following plots, provide a tight big - O bound, a
Q pts Asymptotic analysis: visually
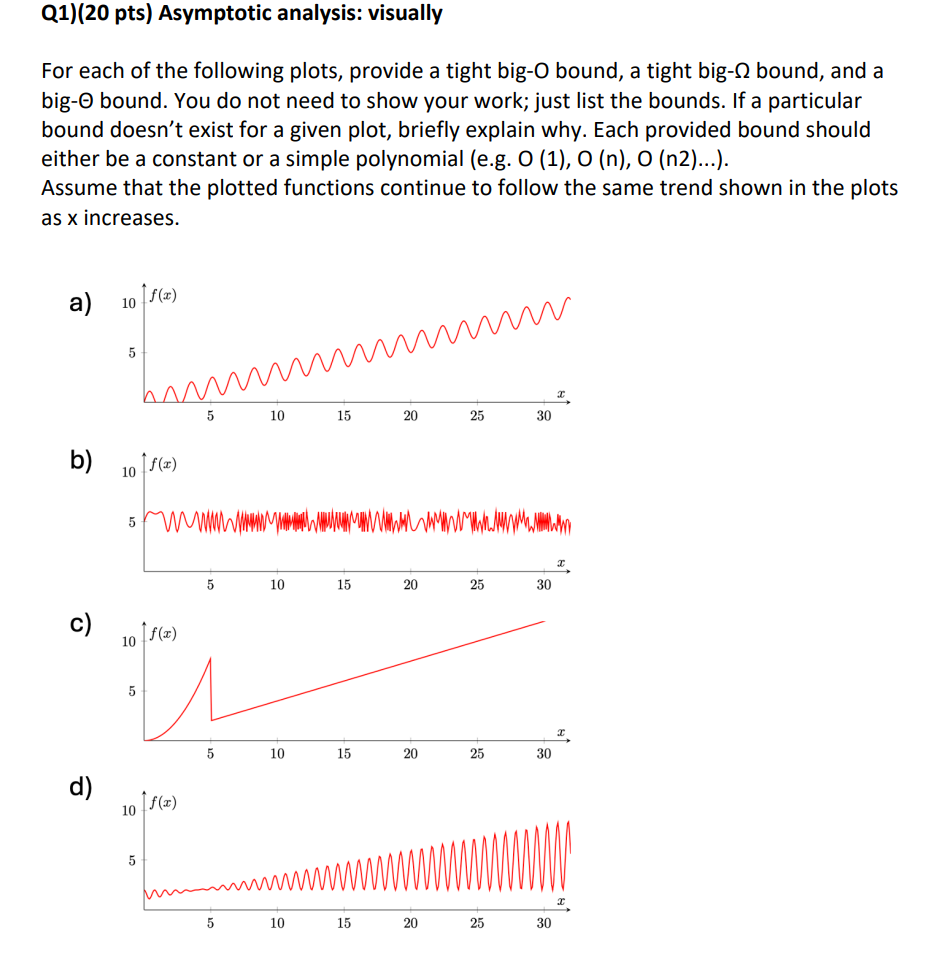
For each of the following plots, provide a tight bigO bound, a tight bigOmega bound, and a bigTheta bound. You do not need to show your work; just list the bounds. If a particular bound doesn't exist for a given plot, briefly explain why. Each provided bound should either be a constant or a simple polynomial eg O O n O n
Assume that the plotted functions continue to follow the same trend shown in the plots as x increases.
b
c
d
Step by Step Solution
There are 3 Steps involved in it
1 Expert Approved Answer
Step: 1 Unlock

Question Has Been Solved by an Expert!
Get step-by-step solutions from verified subject matter experts
Step: 2 Unlock
Step: 3 Unlock