

Question: please explain choose what formula and how to apply it in excel or python 1. Blackbody Radiation Infrared pyrometry is a common method for determining
please explain choose what formula and how to apply it in excel or python
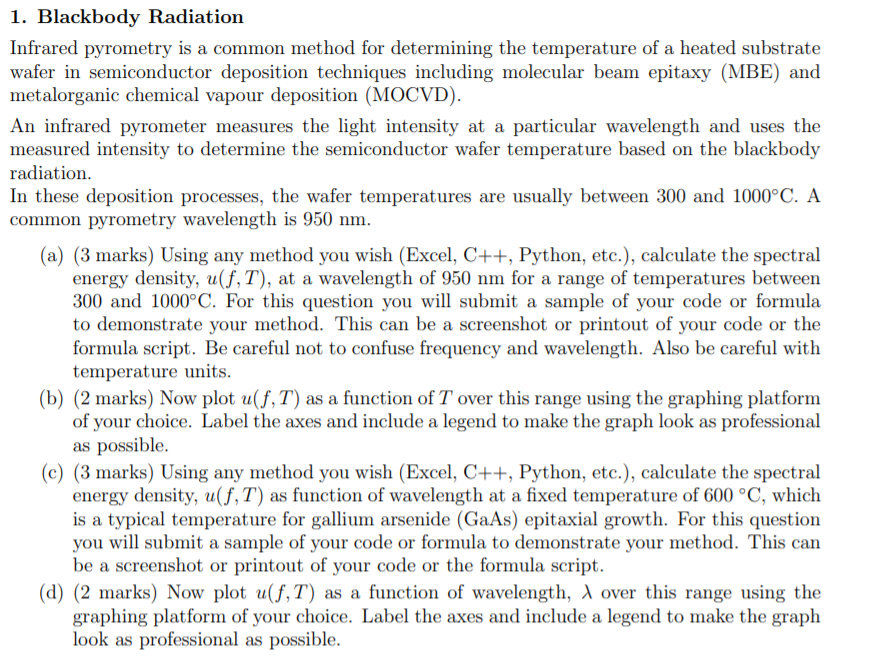
1. Blackbody Radiation Infrared pyrometry is a common method for determining the temperature of a heated substrate wafer in semiconductor deposition techniques including molecular beam epitaxy (MBE) and metalorganic chemical vapour deposition (MOCVD). An infrared pyrometer measures the light intensity at a particular wavelength and uses the measured intensity to determine the semiconductor wafer temperature based on the blackbody radiation. In these deposition processes, the wafer temperatures are usually between 300 and 1000C. A common pyrometry wavelength is 950 nm. (a) (3 marks) Using any method you wish (Excel, C++, Python, etc), calculate the spectral energy density, u(f, T), at a wavelength of 950 nm for a range of temperatures between 300 and IUUUC. For this question you will submit a sample of your code or formula to demonstrate your method. This can be a screenshot or printout of your code or the formula script. Be careful not to confuse frequency and wavelength. Also be careful with temperature units. (b) (2 marks) Now plot u( f , T) as a function of T over this range using the graphing platform of your choice. Label the axes and include a legend to make the graph look as professional as possible. (c) (3 marks) Using any method you wish (Excel, C++, Python, etc), calculate the spectral energy density, u(f, T) as function of wavelength at a xed temperature of 600 \"G, which is a typical temperature for gallium arsenide (GaAs) epitaxial growth. For this question you will submit a sample of your code or formula to demonstrate your method. This can be a screenshot or printout of your code or the formula script. (d) (2 marks] Now plot \"NU , T) as a function of wavelength, A over this range using the graphing platform of your choice. Label the axes and include a legend to make the graph look as professional as possible
Step by Step Solution
There are 3 Steps involved in it

Get step-by-step solutions from verified subject matter experts