

Question: Please explain/ converts the graphs on a paragraphs. Thanks Note: These graphs is reflecting Ghana statistics. GDP GROWTH (ANNUAL %) Inflation, GDP deflator (annual %)
Please explain/ converts the graphs on a paragraphs. Thanks
Note: These graphs is reflecting Ghana statistics. 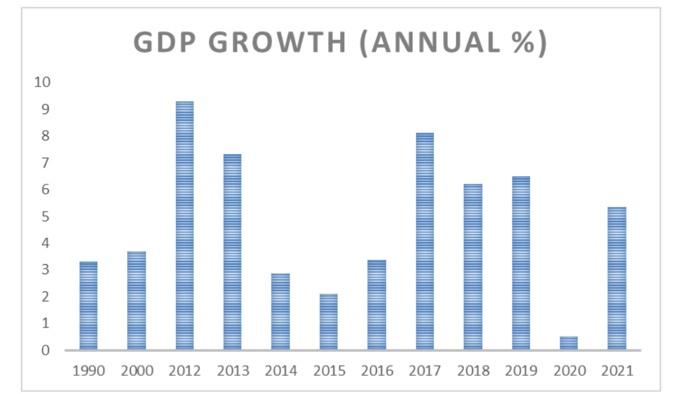
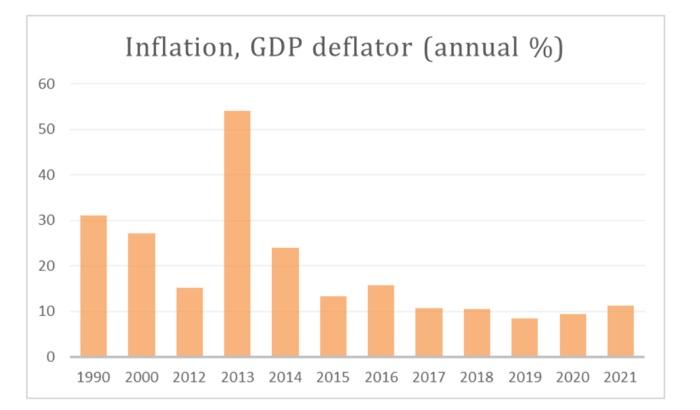
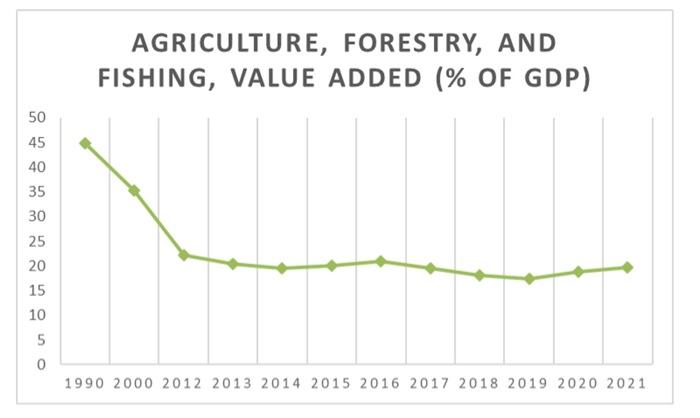
GDP GROWTH (ANNUAL \%) Inflation, GDP deflator (annual \%) 60 50 40 30 20 10 0 199020002012201320142015201620172018201920202021 AGRICULTURE, FORESTRY, AND FISHING, VALUE ADDED (\% OF GDP) 199020002012201320142015201620172018201920202021
Step by Step Solution
There are 3 Steps involved in it
1 Expert Approved Answer
Step: 1 Unlock

Question Has Been Solved by an Expert!
Get step-by-step solutions from verified subject matter experts
Step: 2 Unlock
Step: 3 Unlock