

Question: Please explain each question and show work Problem 3 (On Quality Management, 40 points) Outlet Semi-conductors introduced a new integrated circuit chip several months ago.
Please explain each question and show work
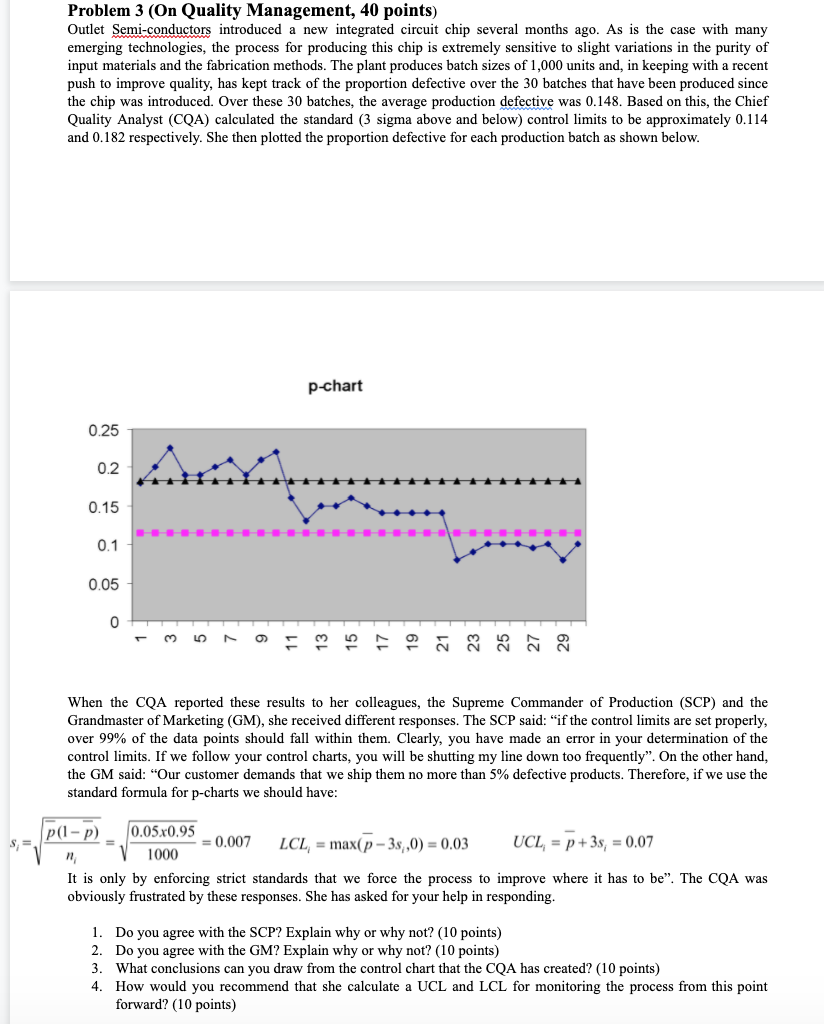
Problem 3 (On Quality Management, 40 points) Outlet Semi-conductors introduced a new integrated circuit chip several months ago. As is the case with many emerging technologies, the process for producing this chip is extremely sensitive to slight variations in the purity of input materials and the fabrication methods. The plant produces batch sizes of 1,000 units and, in keeping with a recent push to improve quality, has kept track of the proportion defective over the 30 batches that have been produced since the chip was introduced. Over these 30 batches, the average production defective was 0.148. Based on this, the Chief Quality Analyst (CQA) calculated the standard (3 sigma above and below) control limits to be approximately 0.114 and 0.182 respectively. She then plotted the proportion defective for each production batch as shown below. p-chart 0.25 0.2 0.15 0.1 0.05 0 0 When the CQA reported these results to her colleagues, the Supreme Commander of Production (SCP) and the Grandmaster of Marketing (GM), she received different responses. The SCP said: if the control limits are set properly, over 99% of the data points should fall within them. Clearly, you have made an error in your determination of the control limits. If we follow your control charts, you will be shutting my line down too frequently". On the other hand, the GM said: "Our customer demands that we ship them no more than 5% defective products. Therefore, if we use the standard formula for p-charts we should have: p(1-P) 0.05x0.95 = 0.007 LCL, = max(p - 38,0) = 0.03 UCL = p +3s, = 0.07 n 1000 It is only by enforcing strict standards that we force the process to improve where it has to be". The CQA was obviously frustrated by these responses. She has asked for your help in responding. 1. Do you agree with the SCP? Explain why or why not? (10 points) 2. Do you agree with the GM? Explain why or why not? (10 points) 3. What conclusions can you draw from the control chart that the CQA has created? (10 points) 4. How would you recommend that she calculate a UCL and LCL for monitoring the process from this point forward? (10 points)Step by Step Solution
There are 3 Steps involved in it
1 Expert Approved Answer
Step: 1 Unlock

Question Has Been Solved by an Expert!
Get step-by-step solutions from verified subject matter experts
Step: 2 Unlock
Step: 3 Unlock