

Question: Please explain each ratio to EXC and how it reflects current events N49.46 /49.47N EXC US C 49.46 +0.38 167 x 374 On 12 Mar
Please explain each ratio to EXC and how it reflects current events
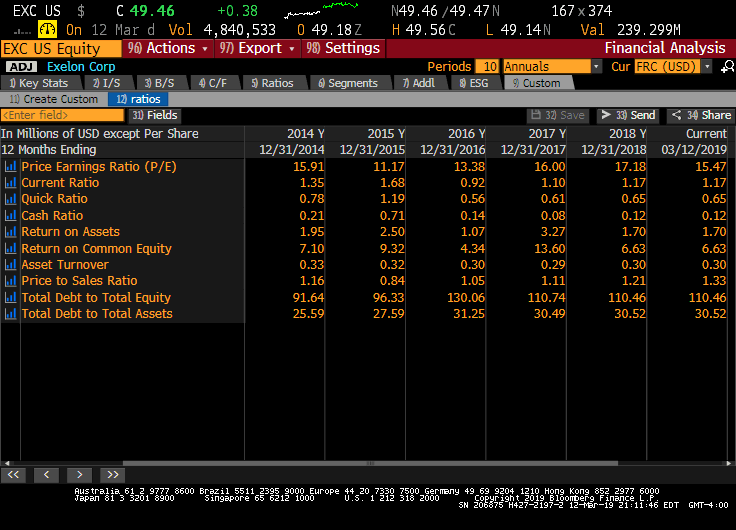
N49.46 /49.47N EXC US C 49.46 +0.38 167 x 374 On 12 Mar d Vol 4,840,533 0 49.18Z H 49.56C L 49.14N Val 239.299M tions 97) Export Settings Financial Analysis EXC US Equity 96) Ac ADJ Exelon Corp Key Stats I/S B/SC/F Ratios Segments Addl ESG Custom 11 Create Custom Periods ur FRC (USD) 12 ratios 32 SaveSend34 Share 31) Fields In Millions of USD except Per Share 12 Months Ending L Price Earnings Ratio (P/E) l Current Ratio 2014 Y 2015 Y 2016 Y 2017 Y 2018 Y 12/31/2014 12/31/2015 12/31/2016 12/31/2017 12/31/2018 03/12/2019 15.47 15.91 1.35 0.7 0.21 13.38 0.9 16 17 1.1 Quick Ratio Cash Ratio 0.6 0.7 0.14 Return on Assets 1. 6 l Return on Common Equity 9.3 0.3 4.34 13 6 Asset Turnover Price to Sales Ratio Total Debt to Total Equity Total Debt to Total Assets 0.3 1.16 91.64 25.59 0.2 96.33 27.59 130.06 110.74 110 110 30 Aus tralia. 61 2 9777 8600 Brazil 5511 2395 Europe 44 20 733 500 Germeny 49 69 9204 1210 Hong Kong 852 2977 6000 ight 2019 B1oomber g Finance L.P apan 81 5 5201 8900Singapore 65 6212 1000U.3. 1 212 516 2000SN 203S H42719 19 218146 EDT GMT-4:00 N49.46 /49.47N EXC US C 49.46 +0.38 167 x 374 On 12 Mar d Vol 4,840,533 0 49.18Z H 49.56C L 49.14N Val 239.299M tions 97) Export Settings Financial Analysis EXC US Equity 96) Ac ADJ Exelon Corp Key Stats I/S B/SC/F Ratios Segments Addl ESG Custom 11 Create Custom Periods ur FRC (USD) 12 ratios 32 SaveSend34 Share 31) Fields In Millions of USD except Per Share 12 Months Ending L Price Earnings Ratio (P/E) l Current Ratio 2014 Y 2015 Y 2016 Y 2017 Y 2018 Y 12/31/2014 12/31/2015 12/31/2016 12/31/2017 12/31/2018 03/12/2019 15.47 15.91 1.35 0.7 0.21 13.38 0.9 16 17 1.1 Quick Ratio Cash Ratio 0.6 0.7 0.14 Return on Assets 1. 6 l Return on Common Equity 9.3 0.3 4.34 13 6 Asset Turnover Price to Sales Ratio Total Debt to Total Equity Total Debt to Total Assets 0.3 1.16 91.64 25.59 0.2 96.33 27.59 130.06 110.74 110 110 30 Aus tralia. 61 2 9777 8600 Brazil 5511 2395 Europe 44 20 733 500 Germeny 49 69 9204 1210 Hong Kong 852 2977 6000 ight 2019 B1oomber g Finance L.P apan 81 5 5201 8900Singapore 65 6212 1000U.3. 1 212 516 2000SN 203S H42719 19 218146 EDT GMT-4:00
Step by Step Solution
There are 3 Steps involved in it

Get step-by-step solutions from verified subject matter experts