

Question: please explain how this Excel solved the problem For this assignment, update the spreadsheets you created in 4.4 Assignment: Cash Flow Diagram and NPV Calculation
please explain how this Excel solved the problem
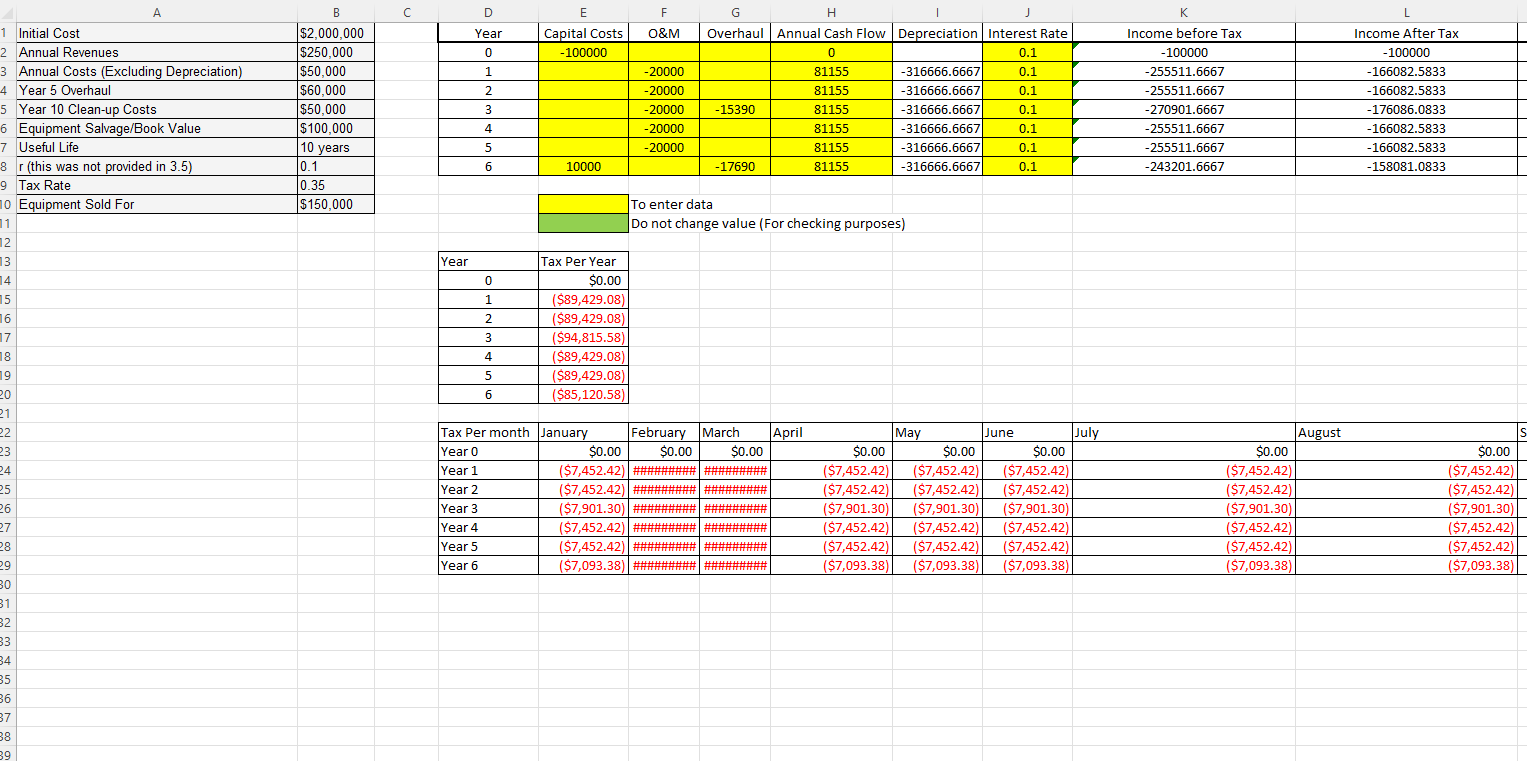
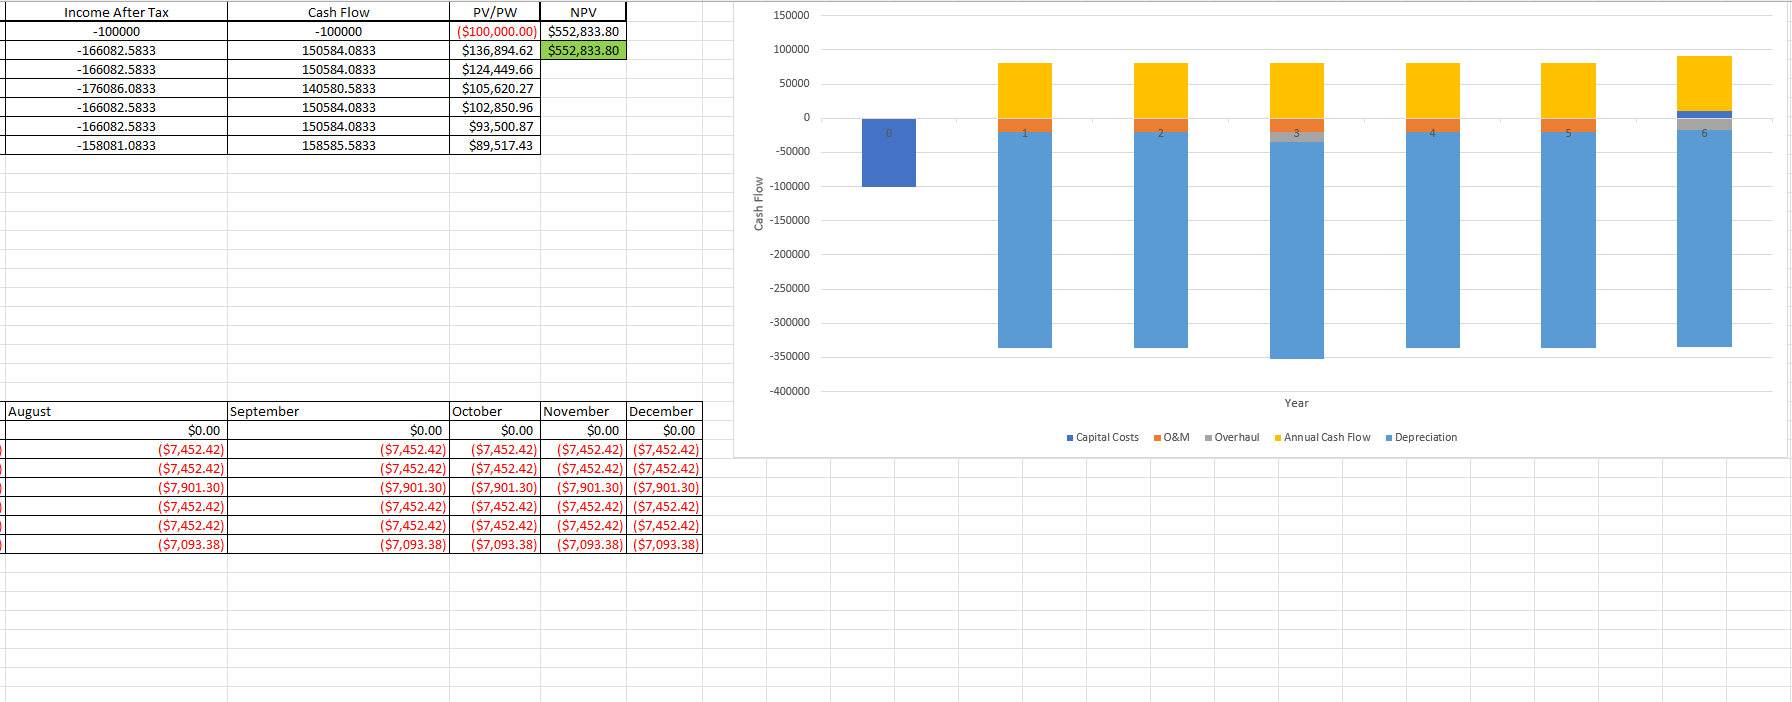
For this assignment, update the spreadsheets you created in 4.4 Assignment: Cash Flow Diagram and NPV Calculation to incorporate depreciation and taxes. This will require you to consider, and model before tax cash flows and after-tax cash flows in your models and then determine the appropriate output for your model. Assume straight-line depreciation and use a cost of capital of 10%.
Inputs from the user include initial investment, marginal tax rate, useful life, salvage value, MARR, annual benefits (revenue), and annual costs.
The inputs for your submission are:
| Initial Cost | $2,000,000 |
| Annual Revenues | $250,000 |
| Annual Costs (Excluding Depreciation) except for the year the overhaul is completed, costs are 0 | $50,000 |
| Year 5 Overhaul | $60,000 |
| Year 10 Clean-up Costs | $50,000 |
| Equipment Salvage/Book Value | $100,000 |
| Useful Life | 10 years |
| r (different than previously provided) | 0.10 |
| Tax Rate | 0.35 |
| Equipment Sold For | $150,000 |
Your model should show the before-tax and after-tax cash flows, as well as the PV of the AFTC in each year and, of course, the NPV, which is the final solution. Tab 1 should appear as described above. Tab 2 should be a ready-to-use generic version of the model that can be used for similar analysis. Make sure your model includes instructions and clearly identifies where users would provide inputs.
Step by Step Solution
There are 3 Steps involved in it

Get step-by-step solutions from verified subject matter experts