Question: Please explain how this is not clear... rather then simply commenting not clear Part 1: The Wilson Stress Profile for Teachers contains nine scales, four
Please explain how this is not clear... rather then simply commenting "not clear"
Part 1: The Wilson Stress Profile for Teachers contains nine scales, four of which are designed to assess teacher stress in relation between a teacher and 1) administrators, 2) colleagues, 3) parents and 4) students. These scores become 1 4. In the data set below. The test is given to equal numbers of teachers by gender and academic level. In this case, we will only use 2 4.
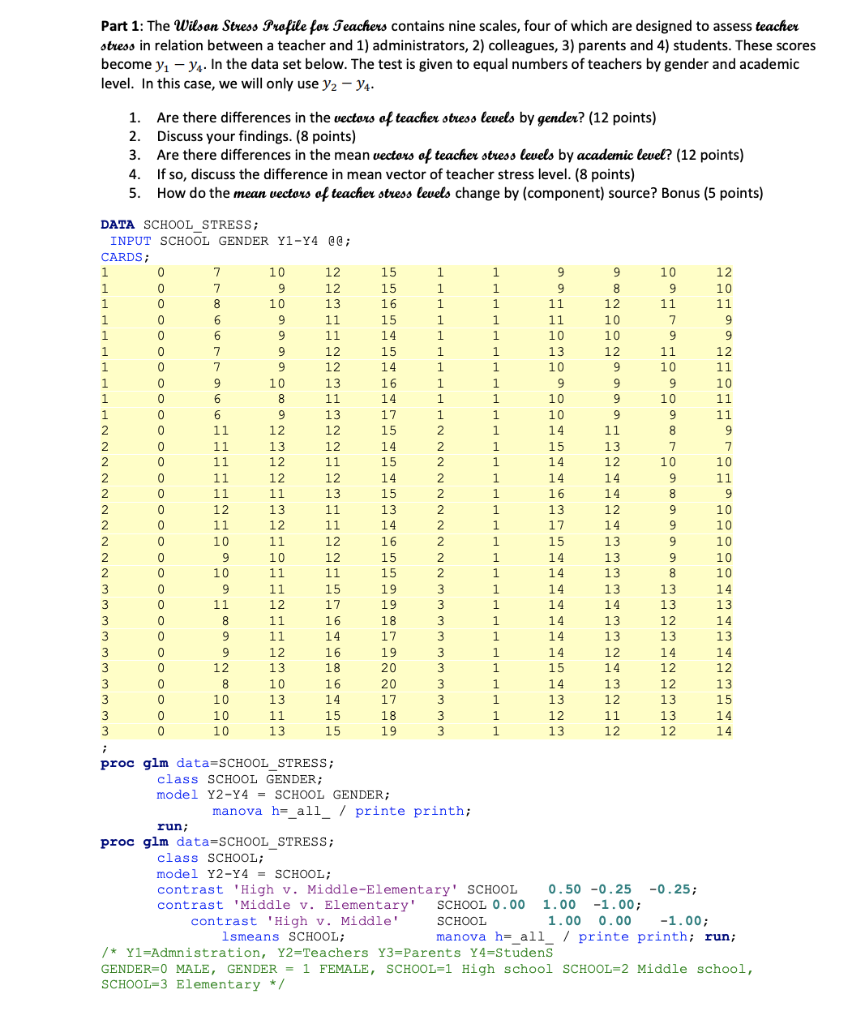
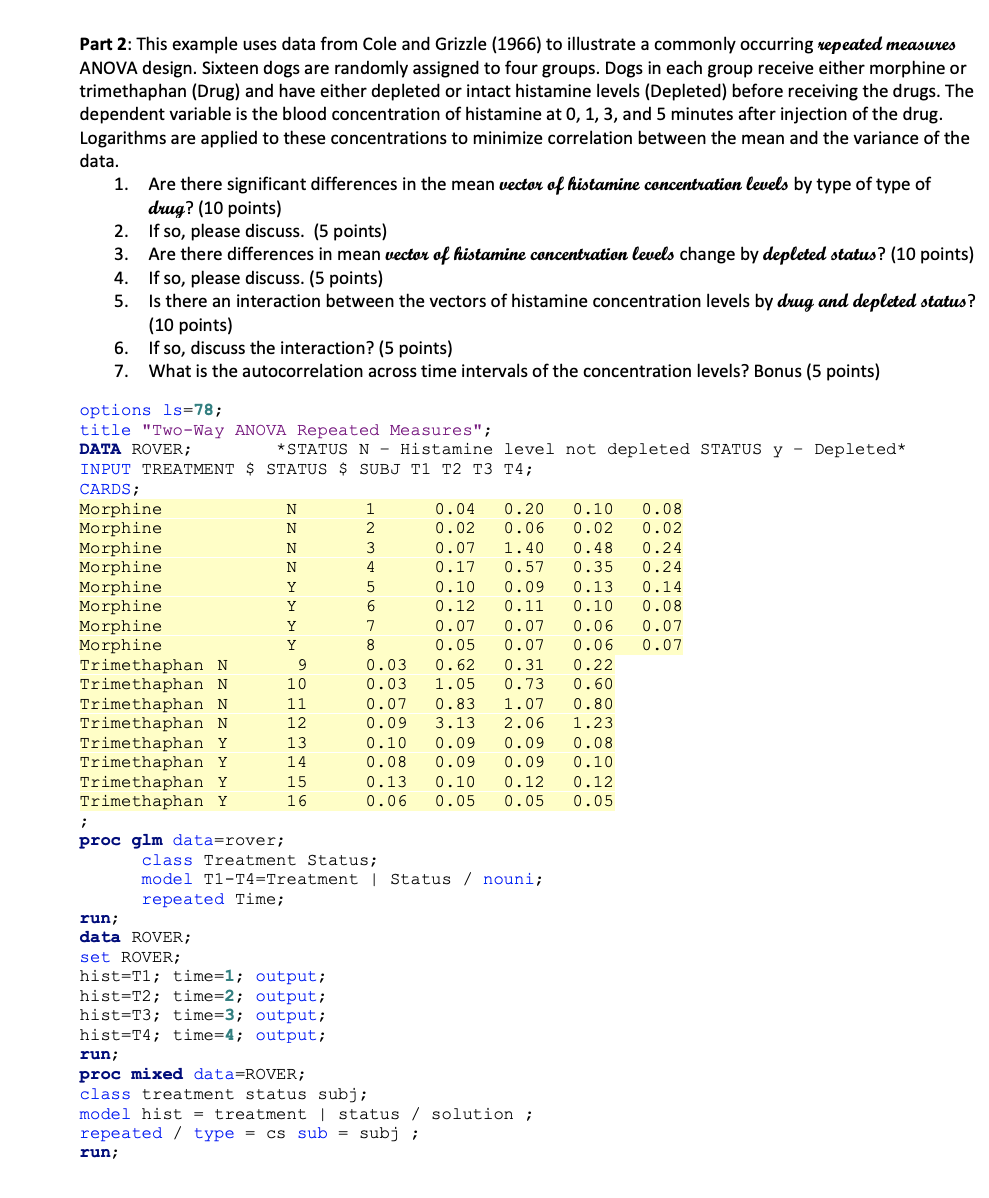
Part 1: The Wilson Stress Profile for Teachers contains nine scales, four of which are designed to assess teacher stress in relation between a teacher and 1) administrators, 2) colleagues, 3) parents and 4) students. These scores become y - 74. In the data set below. The test is given to equal numbers of teachers by gender and academic level. In this case, we will only use y2 - 94. 9 1 Are there differences in the vectors of teacher stress levels by gender? (12 points) 2. Discuss your findings. (8 points) 3. Are there differences in the mean vectors of teacher stress levels by academic level? (12 points) 4. If so, discuss the difference in mean vector of teacher stress level. (8 points) 5. How do the mean vectors of teacher stress levels change by (component) source? Bonus (5 points) DATA SCHOOL_STRESS; INPUT SCHOOL GENDER Y1-14 @@; CARDS; 1 0 7 10 12 15 1 1 9 9 9 10 12 1 0 7 9 12 15 1 1 9 8 1 0 9 10 8 10 13 16 1 1 + 11 12 11 11 1 0 6 9 11 15 1 1 15 11 10 7 9 1 0 6 9 11 14 -- 1 1 10 19 10 9 9 1 0 u 7 9 12 15 12 1 1 13 + 0 12 1 11 12 7 9 12 ++ 14 12 1 10 1 9 1 10 11 1 0 9 10 13 10 16 1 1 9 1 9 9 10 1 0 6 8 11 2 2 14 10 1 1 10 9 10 11 1 0 6 9 10 13 17 1 -- 1 10 9 9 11 2 0 11 10 12 12 15 2 1 14 11 8 9 2 11 13 12 14 2 1 15 13 1 7 7 2 0 11 12 11 15 2 1 14 12 14 10 10 2 0 11 12 12 14 2 1 14 14 9 2 11 0 11 11 11 12 15 13 2 1 16. 14 12 2 9 0 8 12 13 11 11 13 13 2 1 13 10 10 2 12 0 11 11 12 10 11 14 2 1 17 14 9 9 10 2 0 10 11 12 16 16 2 12 13 1 12 10 a 9 15 13 10 2 0 9 12 10 12 15 2 1 14 13 9 2 0 10 11 10 11 11 15 2 1 14 13 13 8 10 3 0 9 9 11 15 19 3 14 1 13 13 14 14 3 0 11 o 12 17. 13 14 12 17 19 3 1 14 1 . 14 19 13 3 8 o 8 11 16 18. 18 3 1 12. 13 19 3 14 0 9 12 > 11 17. I' 3 1 1 14 13 13 a 3 13 13 9 0 12 12 16 19 3 1 14. 1 12 14 3 14 12 14 12 19 13 2 18 10 20 3 20 1 - 15 14 12 12 3 19 0 8. 10 10 16 20 1 3 20 1 1 14 13 12 3 0 1 13 10 13 14 17 3 1 13 12 13 15 3 0 10 11 15 18 3 1 12 11 13 3 14 0 10 13 15 19 3 1 13 12 12 14 ; proc glm data=SCHOOL STRESS; class SCHOOL GENDER; model Y2-Y4 - SCHOOL GENDER; ; manova h=_all_ / printe printh; run; proc glm data=SCHOOL_STRESS; class SCHOOL; model Y2-Y4 = SCHOOL; contrast 'High v. Middle-Elementary' SCHOOL 0.50 -0.25 -0.25; contrast 'Middle v. Elementary' SCHOOL 0.00 1.00 -1.00; contrast 'High v. Middle' SCHOOL 1.00 0.00 -1.00; Ismeans SCHOOL; manova h=_all_ / printe printh; run; /* Yl=Admnistration, Y2=Teachers Y3=Parents Y4=Studens GENDER=0 MALE, GENDER = 1 FEMALE, SCHOOL=1 High school SCHOOL=2 Middle school, SCHOOL=3 Elementary */ 13 14 14 Part 2: This example uses data from Cole and Grizzle (1966) to illustrate a commonly occurring repeated measures ANOVA design. Sixteen dogs are randomly assigned to four groups. Dogs in each group receive either morphine or trimethaphan (Drug) and have either depleted or intact histamine levels (Depleted) before receiving the drugs. The dependent variable is the blood concentration of histamine at 0, 1, 3, and 5 minutes after injection of the drug. Logarithms are applied to these concentrations to minimize correlation between the mean and the variance of the data. 1. Are there significant differences in the mean vector of histamine concentration levels by type of type of drug? (10 points) 2. If so, please discuss. (5 points) 3. Are there differences in mean vector of histamine concentration levels change by depleted status? (10 points) 4. If so, please discuss. (5 points) 5. Is there an interaction between the vectors of histamine concentration levels by drug and depleted status? (10 points) 6. If so, discuss the interaction? (5 points) 7. What is the autocorrelation across time intervals of the concentration levels? Bonus (5 points) options ls=78; title "Two-Way ANOVA Repeated Measures"; DATA ROVER; *STATUS N - Histamine level not depleted STATUS y - Depleted* INPUT TREATMENT $ STATUS $ SUBJ T1 T2 T3 T4; CARDS; Morphine N 1 0.04 0.20 0.10 0.08 Morphine N 2 0.02 0.06 0.02 0.02 Morphine N 3 0.07 1.40 0.48 0.24 Morphine N 4 0.17 0.57 0.35 0.24 Morphine Y 5 0.10 0.09 0.13 0.14 Morphine Y 6 0.12 0.11 0.10 0.08 Morphine Y 7 0.07 0.07 0.06 0.07 Morphine Y 8 0.05 0.07 0.06 0.07 Trimethaphan N 9 0.03 0.62 0.31 0.22 Trimethaphan N 10 0.03 1.05 0.73 0.60 Trimethaphan N 11 0.07 0.83 1.07 0.80 Trimethaphan N 12 0.09 3.13 2.06 1.23 Trimethaphan Y 13 0.10 0.09 0.09 0.08 Trimethaphan Y 14 0.08 0.09 0.09 0.10 Trimethaphan Y 15 0.13 0.10 0.12 0.12 Trimethaphan Y 16 0.06 0.05 0.05 0.05 ; proc glm data=rover; class Treatment Status; model T1-T4=Treatment | Status / nouni; repeated Time; run data ROVER; set ROVER; hist=T1; time=1; output; hist=T2; time=2; output; hist=T3; time=3; output; hist=T4; time=4; output; run; proc mixed data=ROVER; class treatment status subj; model hist = treatment | status / solution ; repeated / type = cs sub = subj ; run; Part 1: The Wilson Stress Profile for Teachers contains nine scales, four of which are designed to assess teacher stress in relation between a teacher and 1) administrators, 2) colleagues, 3) parents and 4) students. These scores become y - 74. In the data set below. The test is given to equal numbers of teachers by gender and academic level. In this case, we will only use y2 - 94. 9 1 Are there differences in the vectors of teacher stress levels by gender? (12 points) 2. Discuss your findings. (8 points) 3. Are there differences in the mean vectors of teacher stress levels by academic level? (12 points) 4. If so, discuss the difference in mean vector of teacher stress level. (8 points) 5. How do the mean vectors of teacher stress levels change by (component) source? Bonus (5 points) DATA SCHOOL_STRESS; INPUT SCHOOL GENDER Y1-14 @@; CARDS; 1 0 7 10 12 15 1 1 9 9 9 10 12 1 0 7 9 12 15 1 1 9 8 1 0 9 10 8 10 13 16 1 1 + 11 12 11 11 1 0 6 9 11 15 1 1 15 11 10 7 9 1 0 6 9 11 14 -- 1 1 10 19 10 9 9 1 0 u 7 9 12 15 12 1 1 13 + 0 12 1 11 12 7 9 12 ++ 14 12 1 10 1 9 1 10 11 1 0 9 10 13 10 16 1 1 9 1 9 9 10 1 0 6 8 11 2 2 14 10 1 1 10 9 10 11 1 0 6 9 10 13 17 1 -- 1 10 9 9 11 2 0 11 10 12 12 15 2 1 14 11 8 9 2 11 13 12 14 2 1 15 13 1 7 7 2 0 11 12 11 15 2 1 14 12 14 10 10 2 0 11 12 12 14 2 1 14 14 9 2 11 0 11 11 11 12 15 13 2 1 16. 14 12 2 9 0 8 12 13 11 11 13 13 2 1 13 10 10 2 12 0 11 11 12 10 11 14 2 1 17 14 9 9 10 2 0 10 11 12 16 16 2 12 13 1 12 10 a 9 15 13 10 2 0 9 12 10 12 15 2 1 14 13 9 2 0 10 11 10 11 11 15 2 1 14 13 13 8 10 3 0 9 9 11 15 19 3 14 1 13 13 14 14 3 0 11 o 12 17. 13 14 12 17 19 3 1 14 1 . 14 19 13 3 8 o 8 11 16 18. 18 3 1 12. 13 19 3 14 0 9 12 > 11 17. I' 3 1 1 14 13 13 a 3 13 13 9 0 12 12 16 19 3 1 14. 1 12 14 3 14 12 14 12 19 13 2 18 10 20 3 20 1 - 15 14 12 12 3 19 0 8. 10 10 16 20 1 3 20 1 1 14 13 12 3 0 1 13 10 13 14 17 3 1 13 12 13 15 3 0 10 11 15 18 3 1 12 11 13 3 14 0 10 13 15 19 3 1 13 12 12 14 ; proc glm data=SCHOOL STRESS; class SCHOOL GENDER; model Y2-Y4 - SCHOOL GENDER; ; manova h=_all_ / printe printh; run; proc glm data=SCHOOL_STRESS; class SCHOOL; model Y2-Y4 = SCHOOL; contrast 'High v. Middle-Elementary' SCHOOL 0.50 -0.25 -0.25; contrast 'Middle v. Elementary' SCHOOL 0.00 1.00 -1.00; contrast 'High v. Middle' SCHOOL 1.00 0.00 -1.00; Ismeans SCHOOL; manova h=_all_ / printe printh; run; /* Yl=Admnistration, Y2=Teachers Y3=Parents Y4=Studens GENDER=0 MALE, GENDER = 1 FEMALE, SCHOOL=1 High school SCHOOL=2 Middle school, SCHOOL=3 Elementary */ 13 14 14 Part 2: This example uses data from Cole and Grizzle (1966) to illustrate a commonly occurring repeated measures ANOVA design. Sixteen dogs are randomly assigned to four groups. Dogs in each group receive either morphine or trimethaphan (Drug) and have either depleted or intact histamine levels (Depleted) before receiving the drugs. The dependent variable is the blood concentration of histamine at 0, 1, 3, and 5 minutes after injection of the drug. Logarithms are applied to these concentrations to minimize correlation between the mean and the variance of the data. 1. Are there significant differences in the mean vector of histamine concentration levels by type of type of drug? (10 points) 2. If so, please discuss. (5 points) 3. Are there differences in mean vector of histamine concentration levels change by depleted status? (10 points) 4. If so, please discuss. (5 points) 5. Is there an interaction between the vectors of histamine concentration levels by drug and depleted status? (10 points) 6. If so, discuss the interaction? (5 points) 7. What is the autocorrelation across time intervals of the concentration levels? Bonus (5 points) options ls=78; title "Two-Way ANOVA Repeated Measures"; DATA ROVER; *STATUS N - Histamine level not depleted STATUS y - Depleted* INPUT TREATMENT $ STATUS $ SUBJ T1 T2 T3 T4; CARDS; Morphine N 1 0.04 0.20 0.10 0.08 Morphine N 2 0.02 0.06 0.02 0.02 Morphine N 3 0.07 1.40 0.48 0.24 Morphine N 4 0.17 0.57 0.35 0.24 Morphine Y 5 0.10 0.09 0.13 0.14 Morphine Y 6 0.12 0.11 0.10 0.08 Morphine Y 7 0.07 0.07 0.06 0.07 Morphine Y 8 0.05 0.07 0.06 0.07 Trimethaphan N 9 0.03 0.62 0.31 0.22 Trimethaphan N 10 0.03 1.05 0.73 0.60 Trimethaphan N 11 0.07 0.83 1.07 0.80 Trimethaphan N 12 0.09 3.13 2.06 1.23 Trimethaphan Y 13 0.10 0.09 0.09 0.08 Trimethaphan Y 14 0.08 0.09 0.09 0.10 Trimethaphan Y 15 0.13 0.10 0.12 0.12 Trimethaphan Y 16 0.06 0.05 0.05 0.05 ; proc glm data=rover; class Treatment Status; model T1-T4=Treatment | Status / nouni; repeated Time; run data ROVER; set ROVER; hist=T1; time=1; output; hist=T2; time=2; output; hist=T3; time=3; output; hist=T4; time=4; output; run; proc mixed data=ROVER; class treatment status subj; model hist = treatment | status / solution ; repeated / type = cs sub = subj ; run


