

Question: ****PLEASE EXPLAIN HOW TO CONSTRUCT SML GRAPH IN PART A&C IN EXCEL. **** 66. You are given the following information on two securities, the market
****PLEASE EXPLAIN HOW TO CONSTRUCT SML GRAPH IN PART A&C IN EXCEL. ****
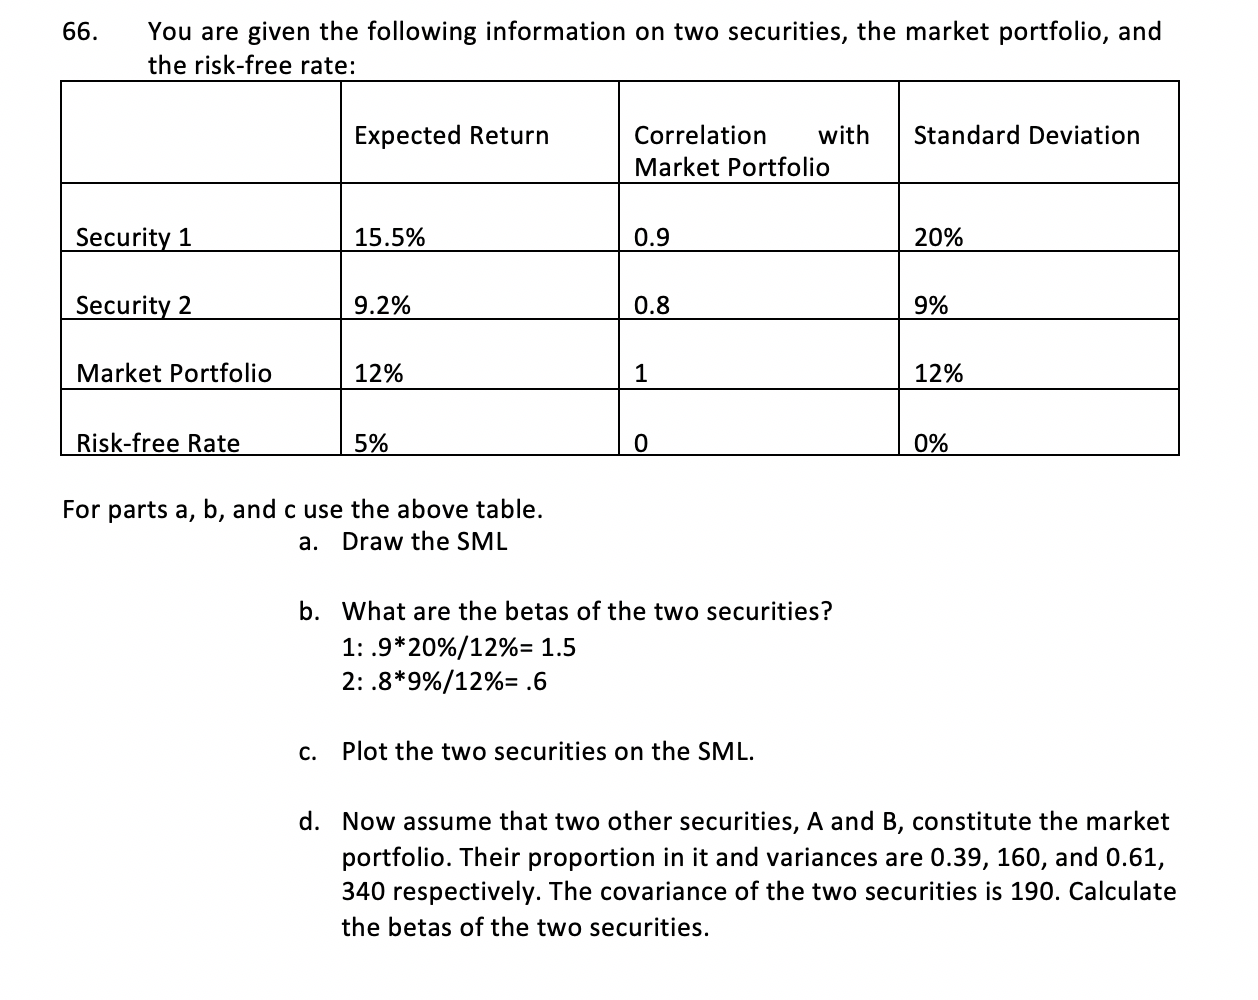
66. You are given the following information on two securities, the market portfolio, and the risk-free rate: Expected Return Correlation with Market Portfolio Standard Deviation Security 1 15.5% 0.9 20% Security 2 9.2% 0.8 9% Market Portfolio 12% 12% Risk-free Rate 5% 0% For parts a, b, and c use the above table. a. Draw the SML b. What are the betas of the two securities? 1: .9*20%/12%= 1.5 2: .8*9%/12%= .6 C. Plot the two securities on the SML. d. Now assume that two other securities, A and B, constitute the market portfolio. Their proportion in it and variances are 0.39, 160, and 0.61, 340 respectively. The covariance of the two securities is 190. Calculate the betas of the two securities. 66. You are given the following information on two securities, the market portfolio, and the risk-free rate: Expected Return Correlation with Market Portfolio Standard Deviation Security 1 15.5% 0.9 20% Security 2 9.2% 0.8 9% Market Portfolio 12% 12% Risk-free Rate 5% 0% For parts a, b, and c use the above table. a. Draw the SML b. What are the betas of the two securities? 1: .9*20%/12%= 1.5 2: .8*9%/12%= .6 C. Plot the two securities on the SML. d. Now assume that two other securities, A and B, constitute the market portfolio. Their proportion in it and variances are 0.39, 160, and 0.61, 340 respectively. The covariance of the two securities is 190. Calculate the betas of the two securities
Step by Step Solution
There are 3 Steps involved in it

Get step-by-step solutions from verified subject matter experts