

Question: please explain how to do this with excel It's not incomplete. You have to find standard deviation of the combined risky portfolio, etc. All the
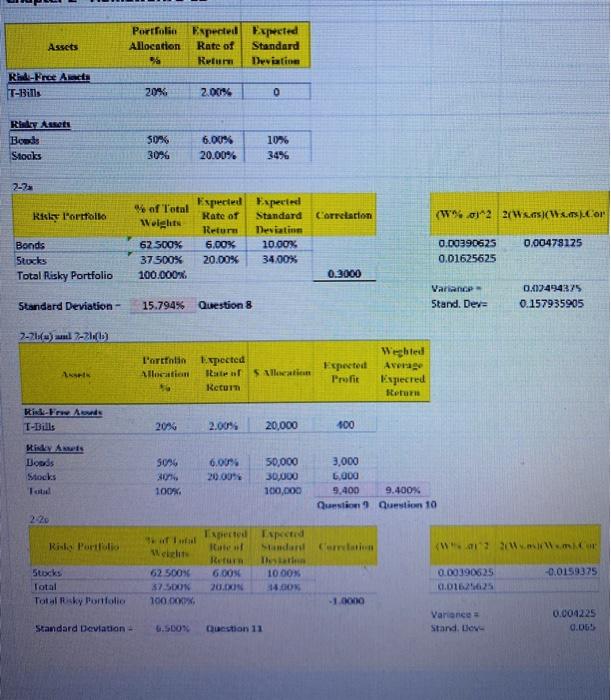
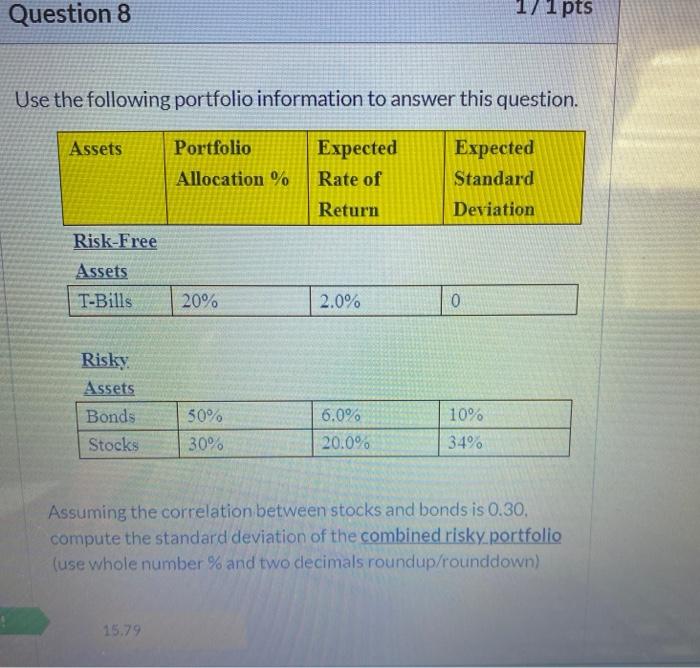
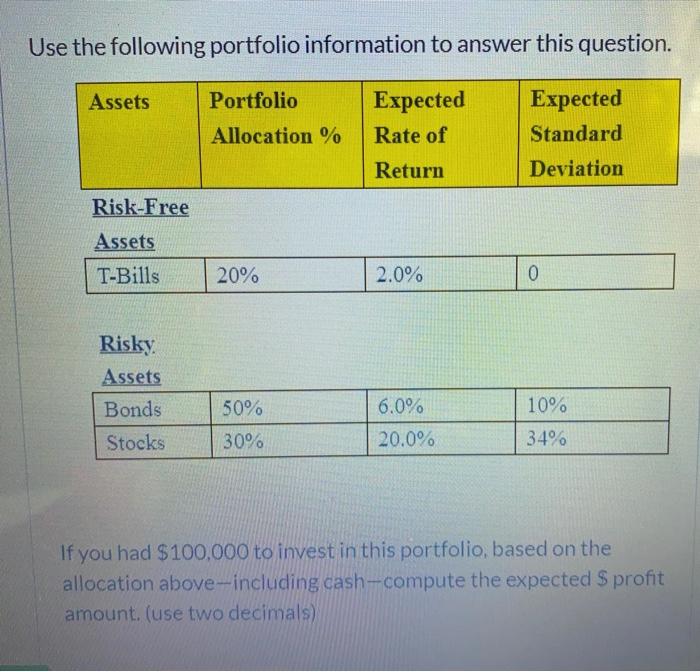
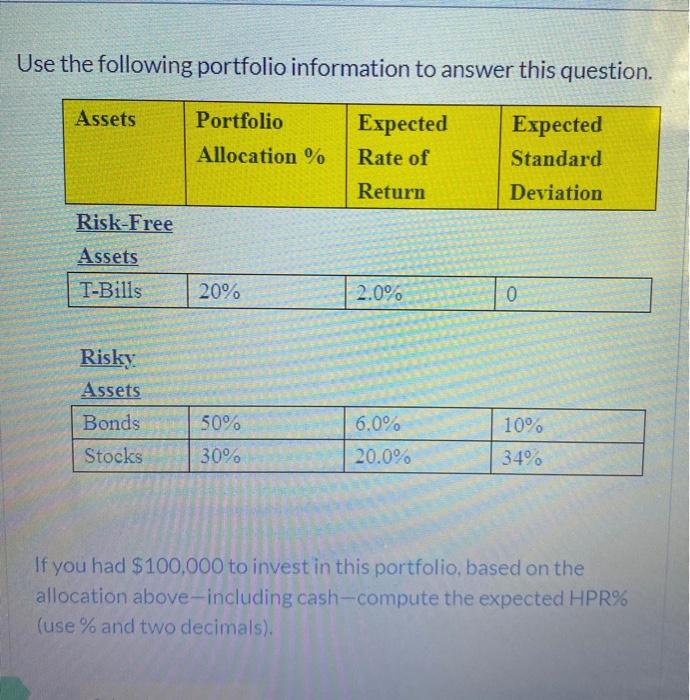
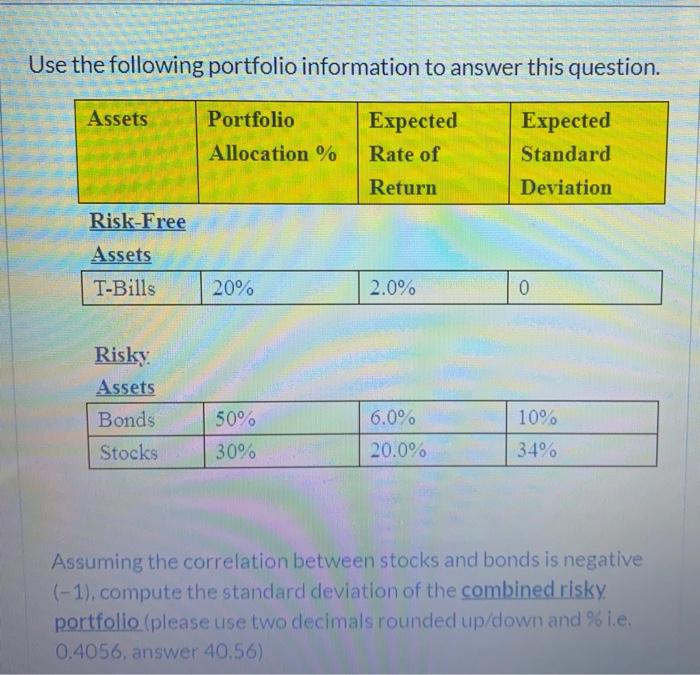
Assets Portfolio Experted Expweted Allocation Rate of Standard % Return Deviating Rh-Free Alsace T-Bills 20% 2.00% 0 Risk Ass Boods Stocks 50% 30% 6.00% 20.00% 10% 3456 2-7 Risley Portfolio Correlation (W%02 2/W..W..Cor of Total Weights 62 500% 375D0% 100.000 Expected Experted Rate of Standard Return Deviatin 6.00% 10.00% 20.00% 34.00% Bonds Stocks Total Risky Portfolio 0.00478175 0.00390625 0.01625625 0.3000 Variance Stand. Der 0.217494375 0.157935905 Standard Deviation - 15.794% Question 8 2-2) ml 7-2) L'artin Expected Allocation I f S x G Return Expected Profit Weghted Average Expecred Reum Rindow. As T-Bills 20% 2.00% 20,000 100 HIRAN Doods Stocks 5096 30 100 6.00 20.00% 50,000 30,000 100,000 3,000 LODO 9,400 9.400% Question question 10 2.20 Risto Parloto W War Welt Stocks Total Totasky Portfolio -0.0159375 Expected Expected Intel Standard Ceration The 6.005 10 00 20.IN 14.00% - 1.000 62 500% 375DON 100 COV, 0.00390625 KLO125 Variance Stand. Love 0.004225 0.055 Standard Deviation - 6.5DOX Question 11 Question 8 1/ 1 pts Use the following portfolio information to answer this question. Assets Portfolio Allocation % Expected Rate of Return Expected Standard Deviation Risk-Free Assets T-Bills 20% 2.0% 0 Risky Assets Bonds Stocks 10% 50% 30% 6.0% 20.0% 34% Assuming the correlation between stocks and bonds is 0.30, compute the standard deviation of the combined risky portfolio (use whole number % and two decimals roundup/rounddown) 15.79 Use the following portfolio information to answer this question. Assets Portfolio Allocation % Expected Rate of Expected Standard Deviation Return Risk-Free Assets T-Bills 20% 2.0% 0 Risky Assets Bonds 50% 10% 6.0% 20.0% Stocks 30% 34% If you had $100.000 to invest in this portfolio, based on the allocation above-including cash-compute the expected $ profit amount. (use two decimals) Use the following portfolio information to answer this question. Assets Portfolio Allocation % Expected Rate of Expected Standard Deviation Return Risk-Free Assets T-Bills 20% 2.0% 0 Risky Assets Bonds 50% 6.0% 10% 34% Stocks 30% 20.0% If you had $100.000 to invest in this portfolio, based on the allocation above-including cash-compute the expected HPR% (use % and two decimals). Use the following portfolio information to answer this question. Assets Portfolio Allocation % Expected Rate of Return Expected Standard Deviation Risk-Free Assets T-Bills 20% 2.0% 0 Risky Assets Bonds Stocks 6.0% 10% 50% 30% 20.0% 34% Assuming the correlation between stocks and bonds is negative (-1), compute the standard deviation of the combined risky portfolio (please use two decimals rounded up/down and %i.e. 0.4056, answer 40.56) Assets Portfolio Experted Expweted Allocation Rate of Standard % Return Deviating Rh-Free Alsace T-Bills 20% 2.00% 0 Risk Ass Boods Stocks 50% 30% 6.00% 20.00% 10% 3456 2-7 Risley Portfolio Correlation (W%02 2/W..W..Cor of Total Weights 62 500% 375D0% 100.000 Expected Experted Rate of Standard Return Deviatin 6.00% 10.00% 20.00% 34.00% Bonds Stocks Total Risky Portfolio 0.00478175 0.00390625 0.01625625 0.3000 Variance Stand. Der 0.217494375 0.157935905 Standard Deviation - 15.794% Question 8 2-2) ml 7-2) L'artin Expected Allocation I f S x G Return Expected Profit Weghted Average Expecred Reum Rindow. As T-Bills 20% 2.00% 20,000 100 HIRAN Doods Stocks 5096 30 100 6.00 20.00% 50,000 30,000 100,000 3,000 LODO 9,400 9.400% Question question 10 2.20 Risto Parloto W War Welt Stocks Total Totasky Portfolio -0.0159375 Expected Expected Intel Standard Ceration The 6.005 10 00 20.IN 14.00% - 1.000 62 500% 375DON 100 COV, 0.00390625 KLO125 Variance Stand. Love 0.004225 0.055 Standard Deviation - 6.5DOX Question 11 Question 8 1/ 1 pts Use the following portfolio information to answer this question. Assets Portfolio Allocation % Expected Rate of Return Expected Standard Deviation Risk-Free Assets T-Bills 20% 2.0% 0 Risky Assets Bonds Stocks 10% 50% 30% 6.0% 20.0% 34% Assuming the correlation between stocks and bonds is 0.30, compute the standard deviation of the combined risky portfolio (use whole number % and two decimals roundup/rounddown) 15.79 Use the following portfolio information to answer this question. Assets Portfolio Allocation % Expected Rate of Expected Standard Deviation Return Risk-Free Assets T-Bills 20% 2.0% 0 Risky Assets Bonds 50% 10% 6.0% 20.0% Stocks 30% 34% If you had $100.000 to invest in this portfolio, based on the allocation above-including cash-compute the expected $ profit amount. (use two decimals) Use the following portfolio information to answer this question. Assets Portfolio Allocation % Expected Rate of Expected Standard Deviation Return Risk-Free Assets T-Bills 20% 2.0% 0 Risky Assets Bonds 50% 6.0% 10% 34% Stocks 30% 20.0% If you had $100.000 to invest in this portfolio, based on the allocation above-including cash-compute the expected HPR% (use % and two decimals). Use the following portfolio information to answer this question. Assets Portfolio Allocation % Expected Rate of Return Expected Standard Deviation Risk-Free Assets T-Bills 20% 2.0% 0 Risky Assets Bonds Stocks 6.0% 10% 50% 30% 20.0% 34% Assuming the correlation between stocks and bonds is negative (-1), compute the standard deviation of the combined risky portfolio (please use two decimals rounded up/down and %i.e. 0.4056, answer 40.56)
Step by Step Solution
There are 3 Steps involved in it

Get step-by-step solutions from verified subject matter experts