

Question: please explain how to solve on excel 4.8 Union Gas reports the following (normalized) figures for gas consumption by households in a metro- politan area
please explain how to solve on excel
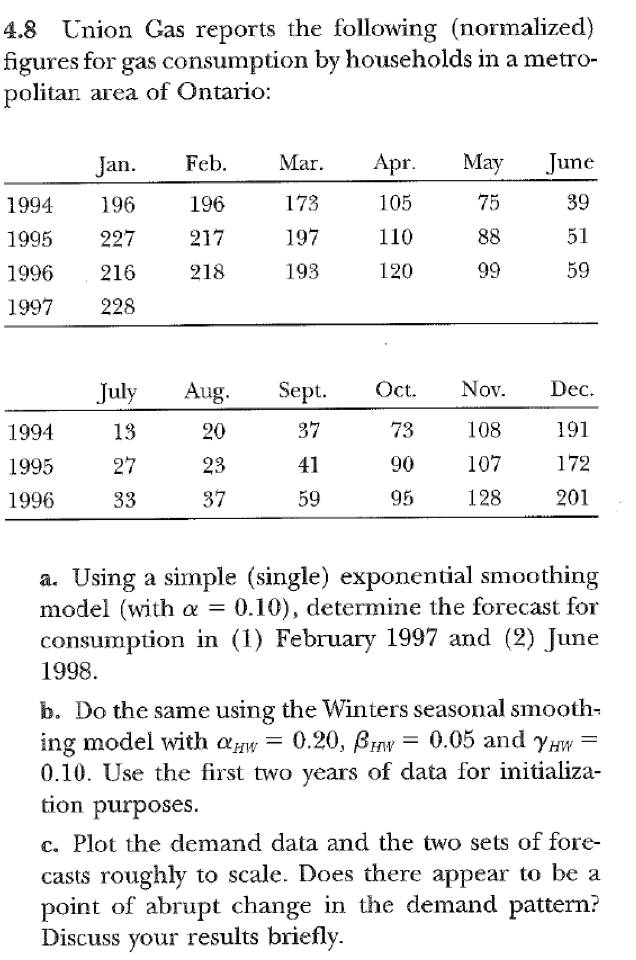
4.8 Union Gas reports the following (normalized) figures for gas consumption by households in a metro- politan area of Ontario:
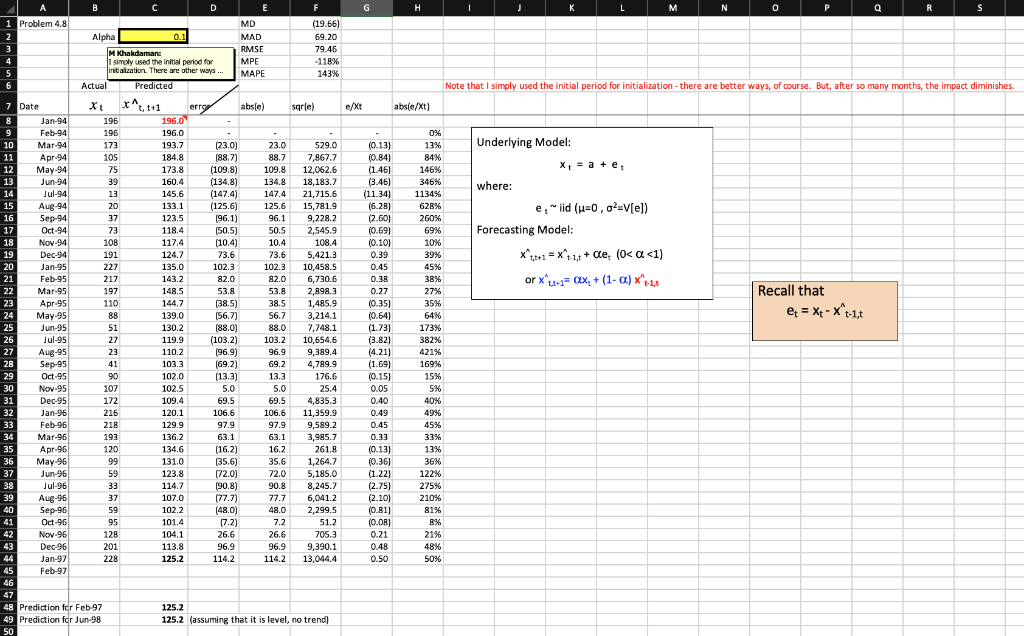
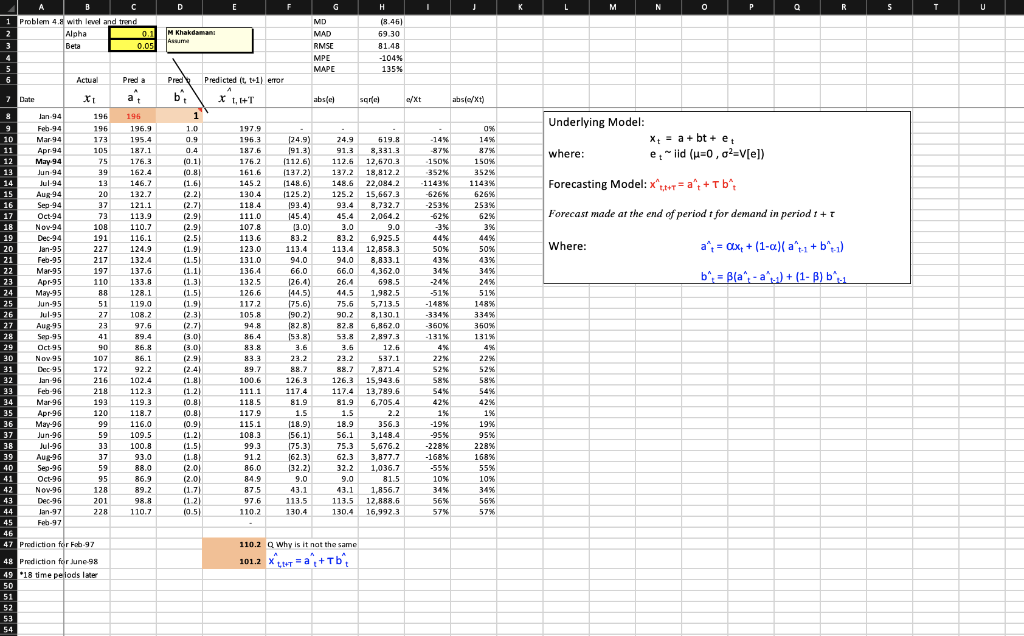
a. Using a simple (single) exponential smoothing model (with a = 0.10), determine the forecast for consumption in (1) February 1997 and (2) June 1998. b. Do the same using the Winters seasonal smooth- ing model with w = 0.20, BHW = 0.05 and YHW 0.10. Use the first two years of data for initializa- tion purposes. c. Plot the demand data and the two sets of fore- casts roughly to scale. Does there appear to be a point of abrupt change in the demand pattern? Discuss your results briefly.
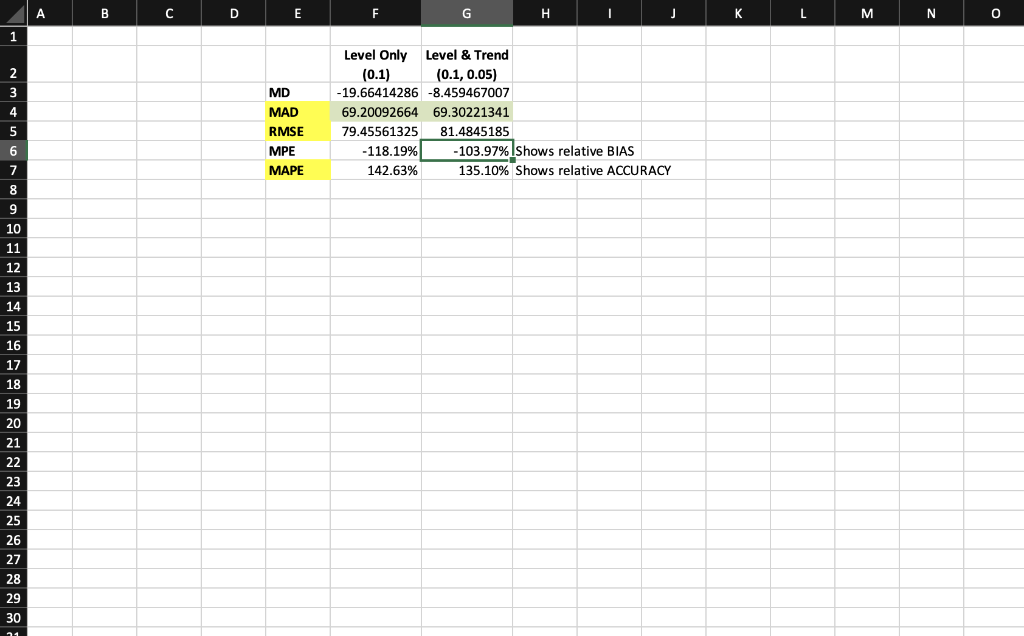
4.8 Union Gas reports the following (normalized) figures for gas consumption by households in a metropolitan area of Ontario: a. Using a simple (single) exponential smoothing model (with =0.10 ), determine the forecast for consumption in (1) February 1997 and (2) June 1998. b. Do the same using the Winters seasonal smoothing model with HW=0.20,HW=0.05 and HW= 0.10 . Use the first two years of data for initialization purposes. c. Plot the demand data and the two sets of forecasts roughly to scale. Does there appear to be a point of abrupt change in the demand pattern? Discuss your results briefly. A B C D H K L Level Only Level \& Trend 1 2 3 4 5 6 7 (0.1) (0.1,0.05) MD \begin{tabular}{|l|l|} \hline-19.66414286 & -8.459467007 \end{tabular} MAD 69.2009266469.30221341 RMSE 79.4556132581.4845185 MPE 118.19% 103.97% Shows relative BIAS MAPE 142.63% 135.10\% Shows relative ACCURACY 8 9 10 11 12 13 14 15 16 17 18 19 20 21 22 23 24 25 26 27 28 29 30 1.142.63%
Step by Step Solution
There are 3 Steps involved in it

Get step-by-step solutions from verified subject matter experts