

Question: Problem 3. Union Gas reports the following (normalized) figures for gas consumption by households in a metropolitan area of Ontario: Jan. Feb. Mar. Apr. May.
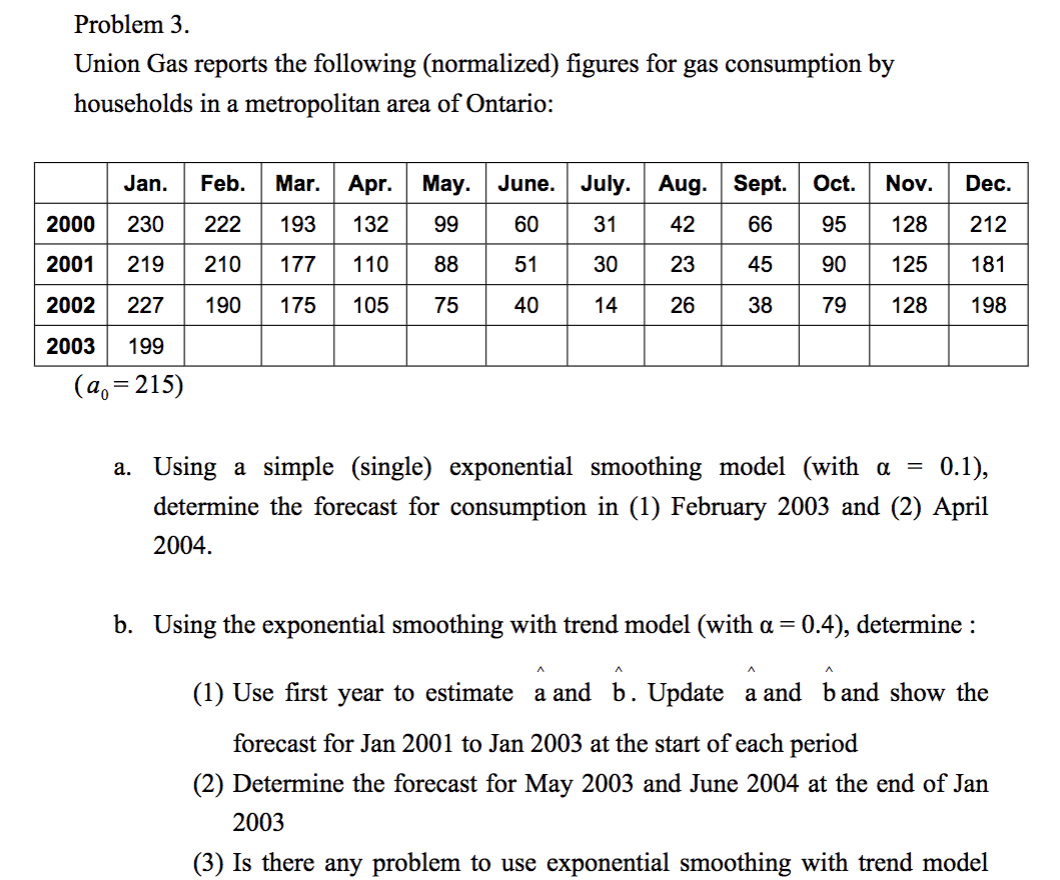
Problem 3. Union Gas reports the following (normalized) figures for gas consumption by households in a metropolitan area of Ontario: Jan. Feb. Mar. Apr. May. June. July. Aug. Sept. Oct. Nov. Dec. 2000 230 222 193 132 99 60 31 42 66 95 128 212 2001 219 210 177 110 88 51 30 23 45 90 125 181 2002 227 190 175 105 75 40 14 26 38 79 128 198 2003 199 (a) = 215) a. Using a simple (single) exponential smoothing model (with a = 0.1), determine the forecast for consumption in (1) February 2003 and (2) April 2004. b. Using the exponential smoothing with trend model (with a = 0.4), determine : (1) Use first year to estimate a and b. Update a and band show the forecast for Jan 2001 to Jan 2003 at the start of each period (2) Determine the forecast for May 2003 and June 2004 at the end of Jan 2003 (3) Is there any problem to use exponential smoothing with trend modelfor this question? Why? Any comment? c. Using the Winters seasonal smoothing model with a =0.1, B,w =0.05 and 7 HW =0.2, and using the first three years of data for initialization purposes to forecast: (1) April 2003 and October 2004 at the end of Jan 2003 (2) If the actual demand on Feb 2003 is 200, the recomputed the forecasting for May 2003 and June 2004
Step by Step Solution
There are 3 Steps involved in it

Get step-by-step solutions from verified subject matter experts