

Question: please explain how to solve without excel Consider the following information on Stocks A, B, C and their returns (in decimals) in each state: State
please explain how to solve without excel 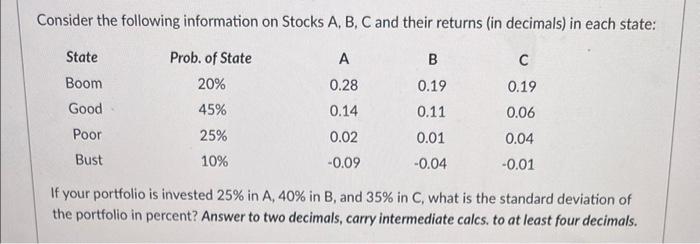
Consider the following information on Stocks A, B, C and their returns (in decimals) in each state: State A B Boom Prob. of State 20% 45% 0.19 Good 0.28 0.14 0.02 0.06 0.19 0.11 0.01 -0.04 Poor 25% 10% 0.04 -0.01 Bust -0.09 If your portfolio is invested 25% in A, 40% in B, and 35% in C, what is the standard deviation of the portfolio in percent? Answer to two decimals, carry intermediate calcs, to at least four decimals
Step by Step Solution
There are 3 Steps involved in it
1 Expert Approved Answer
Step: 1 Unlock

Question Has Been Solved by an Expert!
Get step-by-step solutions from verified subject matter experts
Step: 2 Unlock
Step: 3 Unlock