

Question: Please explain how you obtain the test statistics for Including the expected and observed Does the location of your seat in a classroom play a
Please explain how you obtain the test statistics for Including the expected and observed
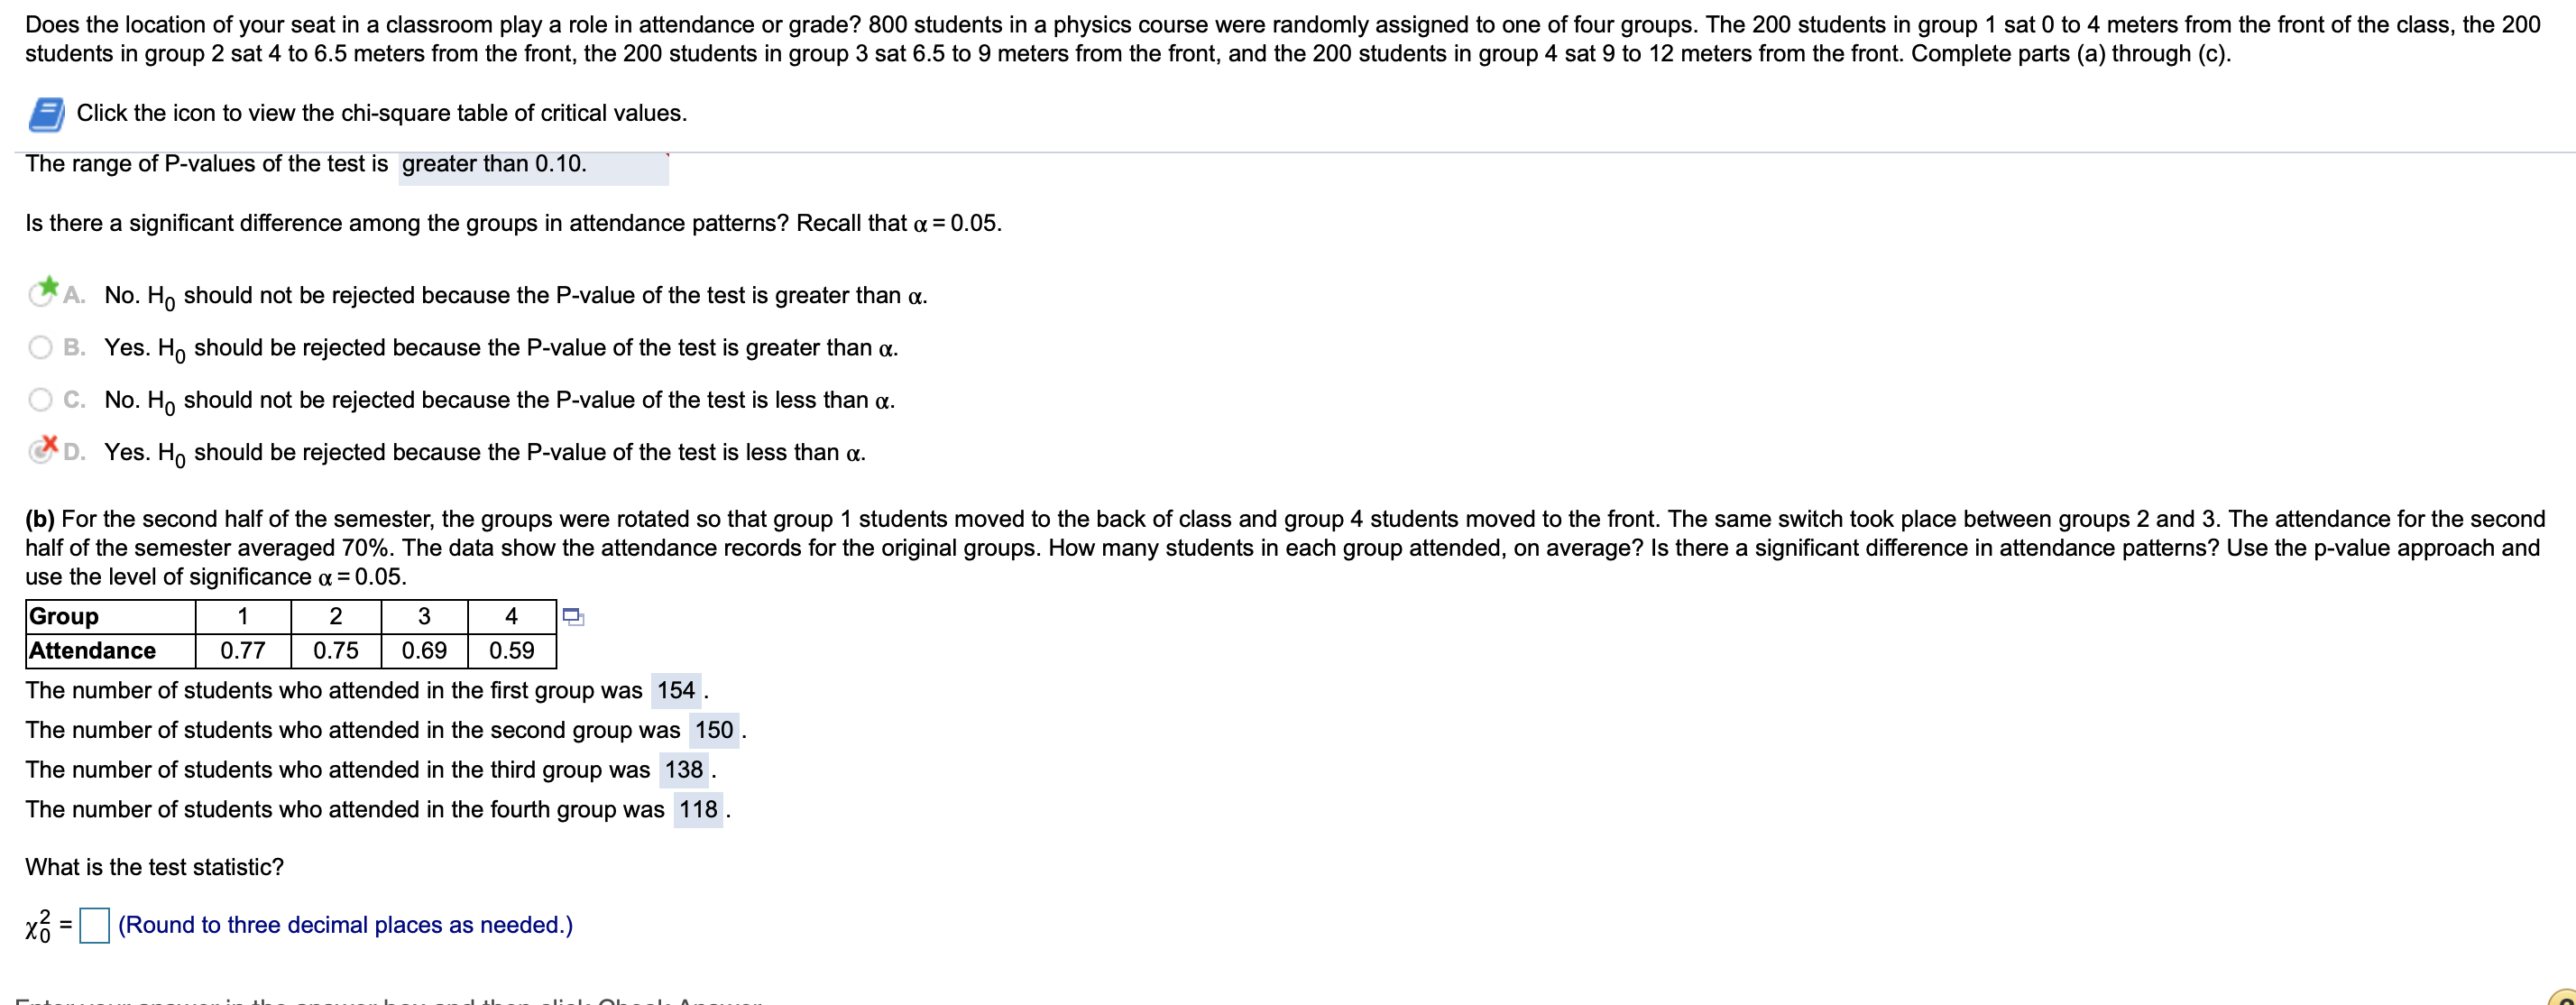
Does the location of your seat in a classroom play a role in attendance or grade? 800 students in a physics course were randomly assigned to one of four groups. The 200 students in group 1 sat 0 to 4 meters from the front of the class. the 200 students in group 2 sat 4 to 6.5 meters from the front, the 200 students in group 3 sat 6.5 to 9 meters from the front, and the 200 students in group 4 sat 9 to 12 meters from the front. Complete parts (a) through (c). a Click the icon to view the chi-square table of critical values. The range of P-values of the test is greater than 0.10. Is there a signicant difference among the groups in attendance patterns? Recall that a= 0.05. *A. No. H0 should not be rejected because the P-value of the test is greater than a. B. Yes. Ho should be rejected because the P-value of the testis greater than or. C. No. H0 should not be rejected because the P-value of the test is less than a. Bx D. Yes, H0 should be rejected because the P-value of the test is less than a. (b) For the second half of the semester, the groups were rotated so that group 1 students moved to the back of class and group 4 students moved to the front. The same switch took place between groups 2 and 3. The attendance for the second half of the semester averaged 70%. The data show the attendance records for the original groups. How many students in each group attended, on average? Is there a signicant difference in attendance patterns? Use the p-value approach and use the level of signicance at = 0.05. Group I 1 2 3 4 la Attendance I 0.77 0.75 0.69 0.59 The number of students who attended in the rst group was 154 . The number of students who attended in the second group was 150 . The number of students who attended in the third group was 138 . The number of students who attended in the fourth group was 118 . What is the test statistic? 13 = (Round to three decimal places as needed.)
Step by Step Solution
There are 3 Steps involved in it

Get step-by-step solutions from verified subject matter experts