

Question: Please explain in detail what this graph shows words explaining this graph and what it shows. Evaluate and analyse this please CO2 emissions in Poland.
Please explain in detail what this graph shows words explaining this graph and what it shows. Evaluate and analyse this please

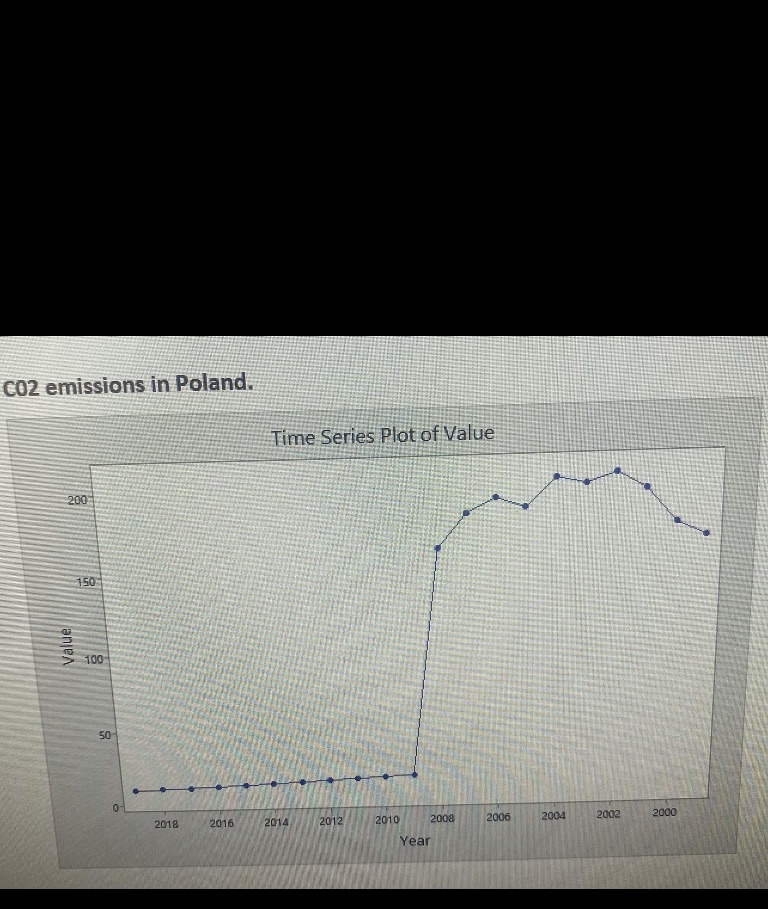
CO2 emissions in Poland. Time Series Plot of Value 200 150 Value 100 50 2014 2008 2006 2002 2000 2018 2016 2012 2010 2004 Year
Step by Step Solution
There are 3 Steps involved in it
1 Expert Approved Answer
Step: 1 Unlock

Question Has Been Solved by an Expert!
Get step-by-step solutions from verified subject matter experts
Step: 2 Unlock
Step: 3 Unlock