

Question: Please explain Question 3 Approximate the Average Deviation from the Mean (ADM) for the 507 adult heights shown in the histogram. The mean height is
Please explain
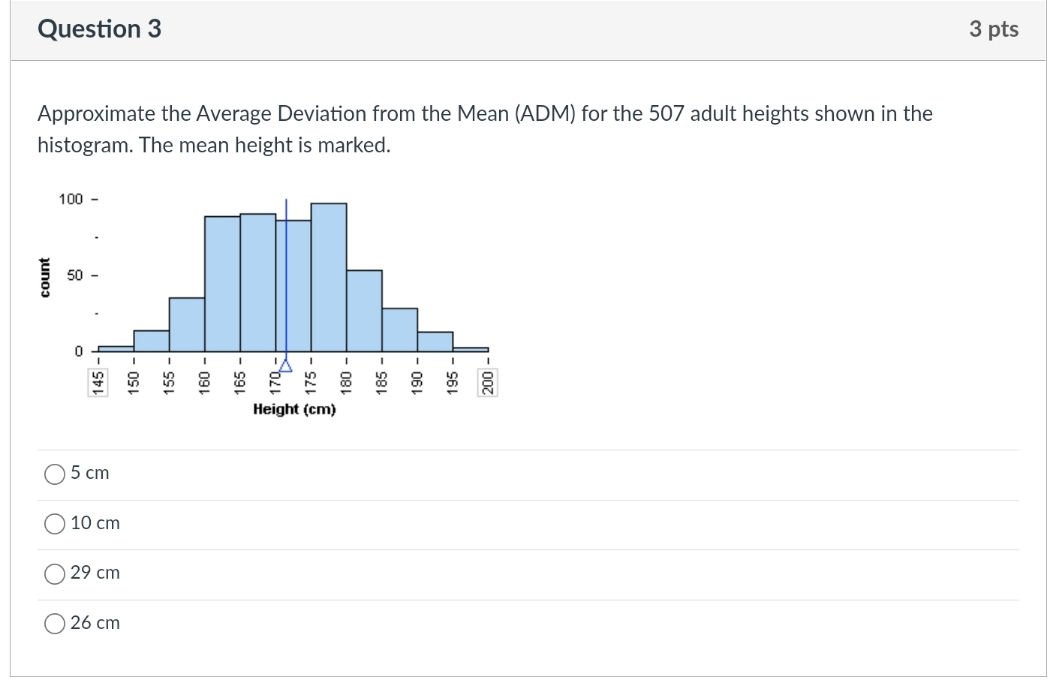
Question 3 Approximate the Average Deviation from the Mean (ADM) for the 507 adult heights shown in the histogram. The mean height is marked
Step by Step Solution
There are 3 Steps involved in it
1 Expert Approved Answer
Step: 1 Unlock

Question Has Been Solved by an Expert!
Get step-by-step solutions from verified subject matter experts
Step: 2 Unlock
Step: 3 Unlock