

Question: please explain step by step in detail on how to solve this problem. my teacher didn't do a good job explaining how to solve this
please explain step by step in detail on how to solve this problem. my teacher didn't do a good job explaining how to solve this problem
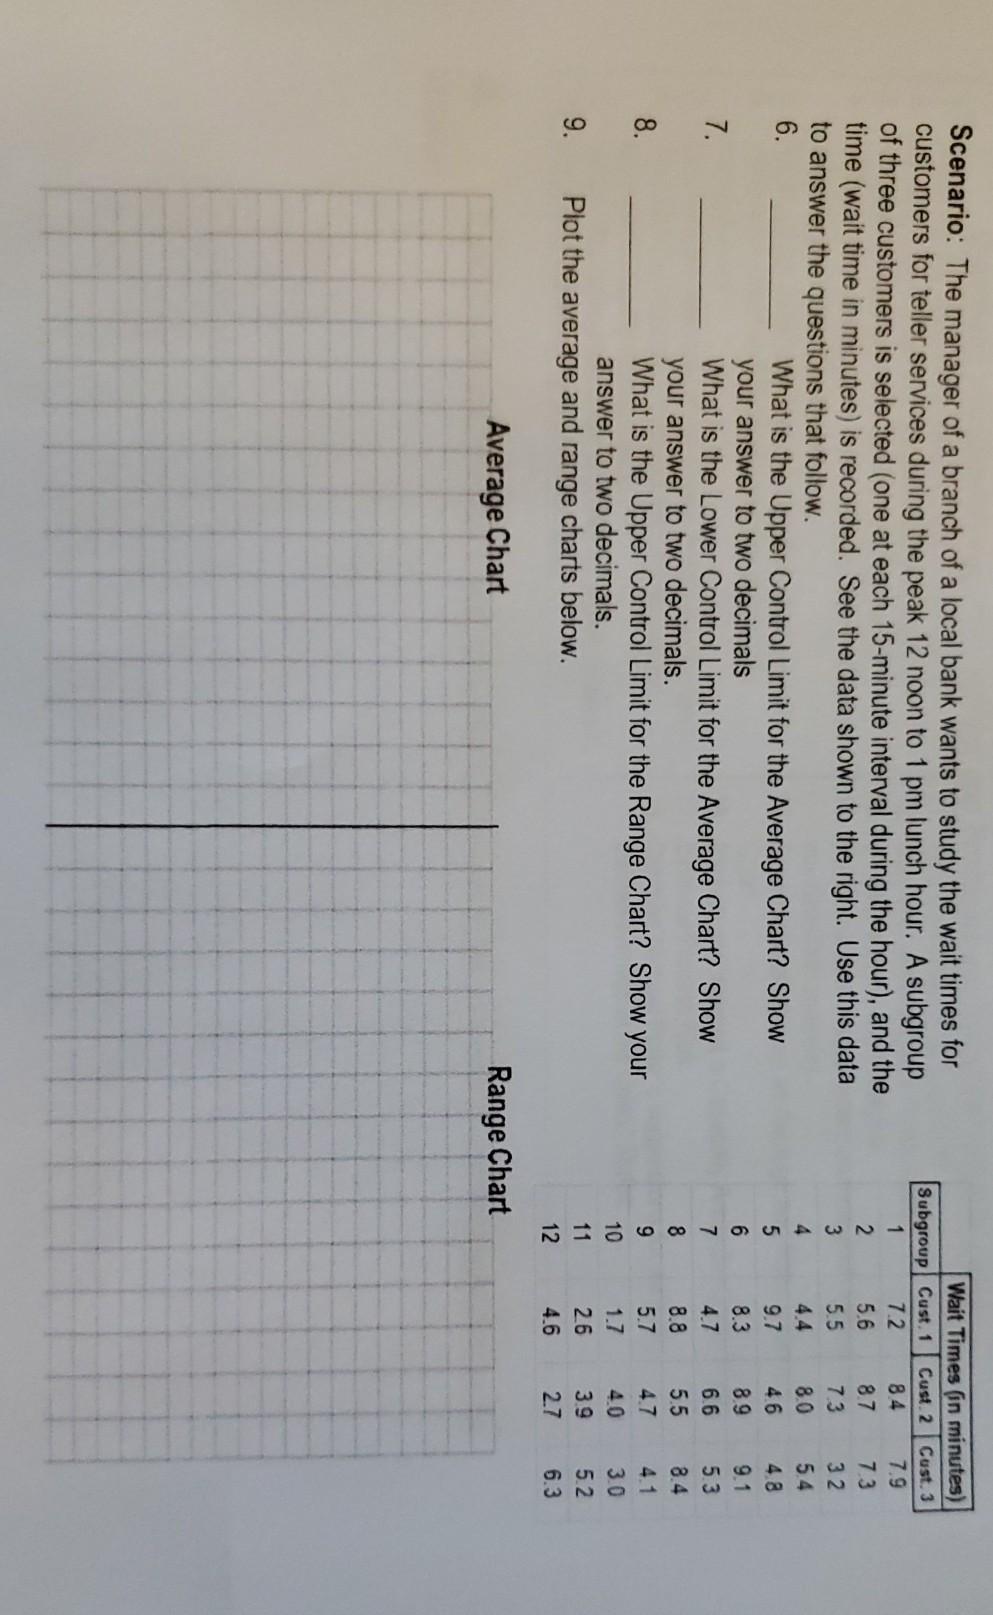
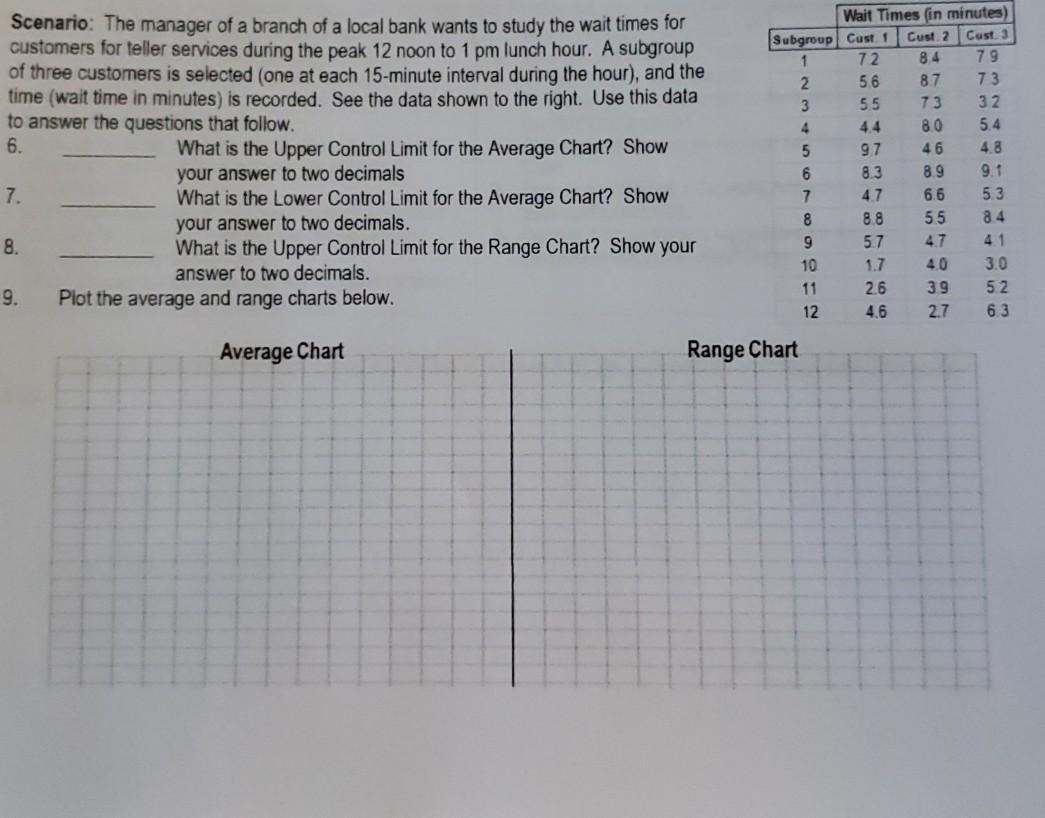
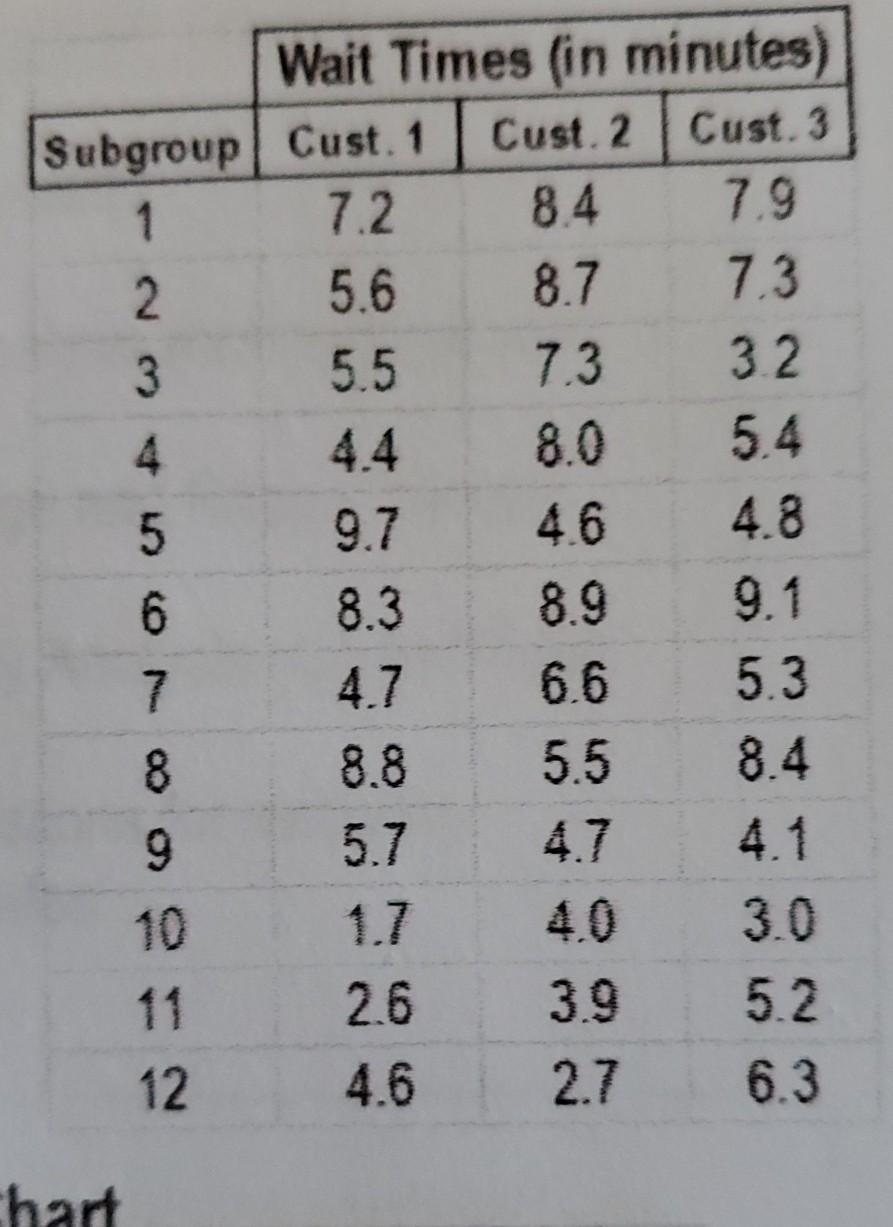
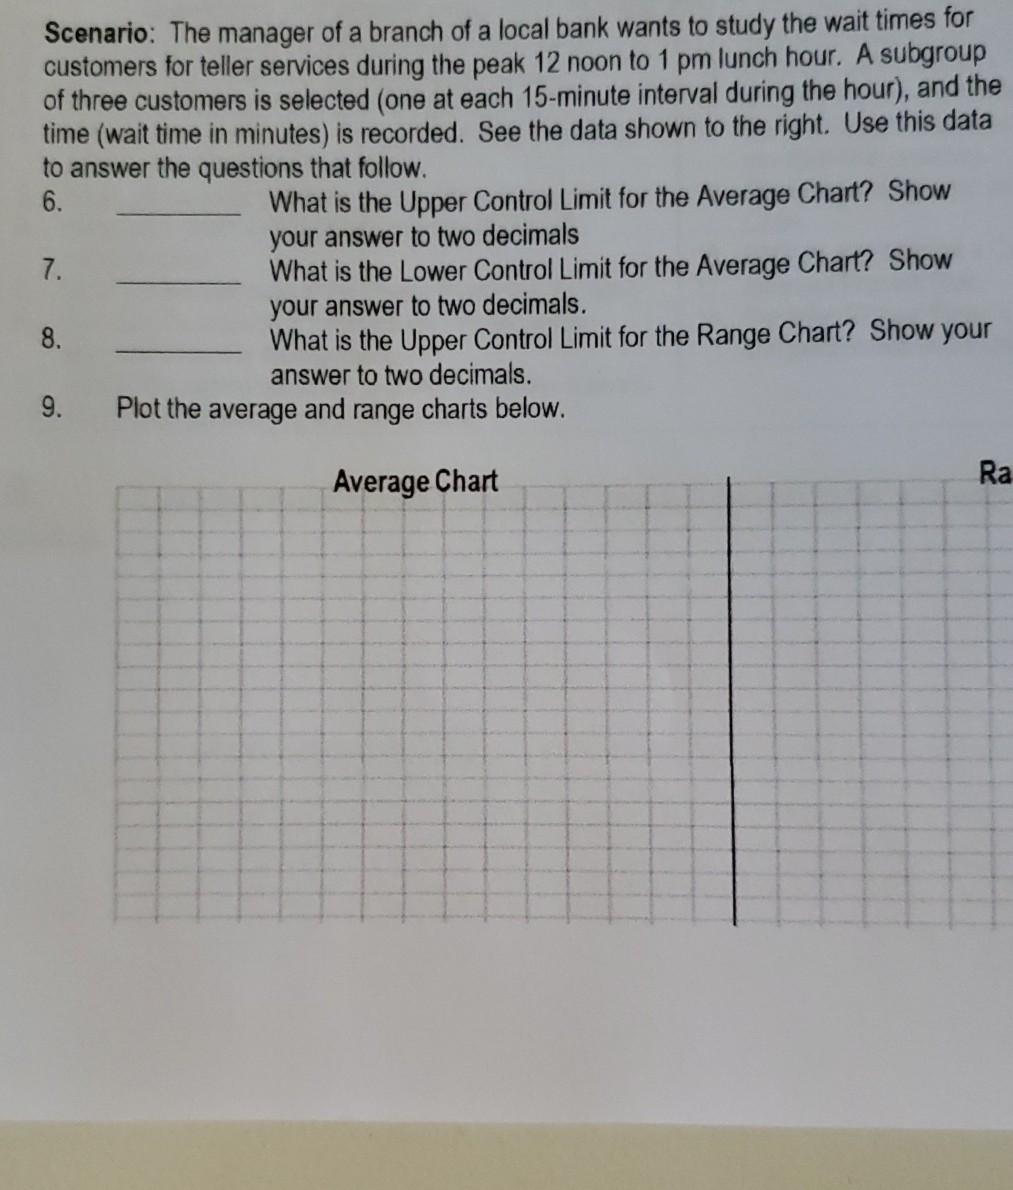
7.3 Scenario: The manager of a branch of a local bank wants to study the wait times for customers for teller services during the peak 12 noon to 1 pm lunch hour. A subgroup of three customers is selected (one at each 15-minute interval during the hour), and the time (wait time in minutes) is recorded. See the data shown to the right. Use this data to answer the questions that follow. 6. What is the Upper Control Limit for the Average Chart? Show your answer to two decimals 7. What is the Lower Control Limit for the Average Chart? Show your answer to two decimals. 8. What is the Upper Control Limit for the Range Chart? Show your answer to two decimals. 9. Plot the average and range charts below. Wait Times (in minutes) Subgroup Cust. 1 Cust. 2 Cust. 3 1 72 84 7.9 2. 5.6 8.7 3 5.5 7.3 32 4 4.4 8.0 5.4 5 9.7 46 4.8 6 8.3 8.9 9.1 7 4.7 6.6 5.3 8 8.8 5.5 8.4 9 5.7 4.7 41 10 1.7 40 3.0 11 26 3.9 5.2 12 4.6 2.7 6.3 Average Chart Range Chart Scenario: The manager of a branch of a local bank wants to study the wait times for customers for teller services during the peak 12 noon to 1 pm lunch hour. A subgroup of three customers is selected (one at each 15-minute interval during the hour), and the time (wait time in minutes) is recorded. See the data shown to the right. Use this data to answer the questions that follow. 6. What is the Upper Control Limit for the Average Chart? Show your answer to two decimals 7. What is the Lower Control Limit for the Average Chart? Show your answer to two decimals. 8. What is the Upper Control Limit for the Range Chart? Show your answer to two decimals. 9. Plot the average and range charts below. Wait Times (in minutes) Subgroup Cust. 1 Cust. 2 Cust. 3 1 72. 8.4 79 2 5.6 87 73 3 5.5 73 32 4 4.4 80 5.4 5 97 46 4.8 6 8.3 8.9 9.1 7 4.7 66 5.3 8 8.8 55 8.4 9 5.7 47 41 10 1.7 40 3.0 11 2.6 39 52 12 4.6 2.7 6.3 Average Chart Range Chart Wait Times (in minutes) Subgroup Cust. 1 Cust.2 Cust. 3 1 7.2. 8.4 7.9 2. 5.6 8.7 7.3 3 5.5 7.3 3.2 4 4.4 8.0 5.4 5 9.7 46 4.8 6 8.3 8.9 9.1 7 4.7 6.6 5.3 8 8.8 5.5 8.4 9 5.7 4.7 4.1 40 3.0 26 5.2. 12 4.6 2.7 6.3 3.9 hart Scenario: The manager of a branch of a local bank wants to study the wait times for customers for teller services during the peak 12 noon to 1 pm lunch hour. A subgroup of three customers is selected (one at each 15-minute interval during the hour), and the time (wait time in minutes) is recorded. See the data shown to the right. Use this data to answer the questions that follow. 6. What is the Upper Control Limit for the Average Chart? Show your answer to two decimals 7. What is the Lower Control Limit for the Average Chart? Show your answer to two decimals. 8. What is the Upper Control Limit for the Range Chart? Show your answer to two decimals. 9. Plot the average and range charts below. Average Chart Ra
Step by Step Solution
There are 3 Steps involved in it
1 Expert Approved Answer
Step: 1 Unlock

Question Has Been Solved by an Expert!
Get step-by-step solutions from verified subject matter experts
Step: 2 Unlock
Step: 3 Unlock