

Question: Please explain step by step, include a histogram with a bell curve. A group of researchers examined the effects of different working shifts on the
Please explain step by step, include a histogram with a bell curve.
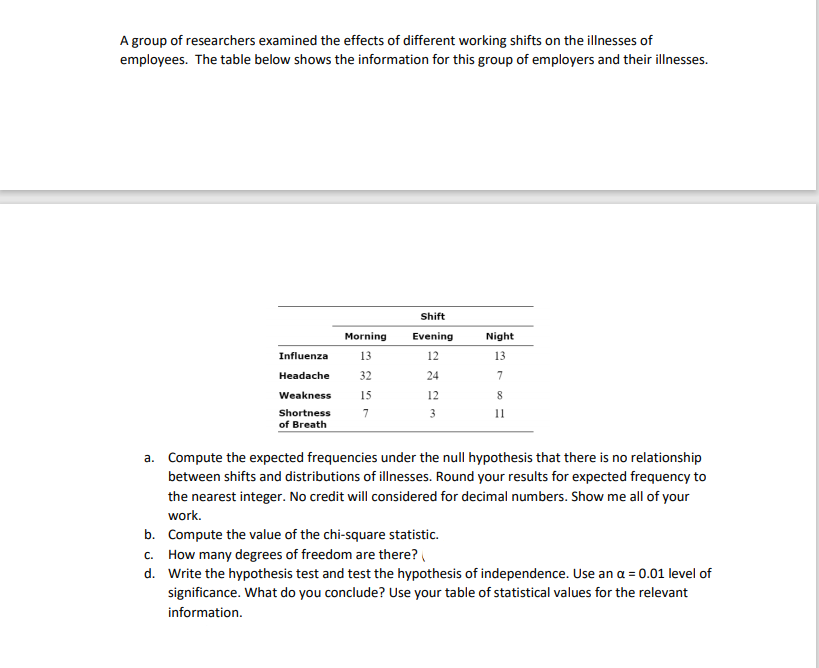
A group of researchers examined the effects of different working shifts on the illnesses of employees. The table below shows the information for this group of employers and their illnesses. Shift Morning Evening Night Influenza 13 12 13 Headache 32 24 7 Weakness 15 12 8 Shortness 7 3 11 of Breath a. Compute the expected frequencies under the null hypothesis that there is no relationship between shifts and distributions of illnesses. Round your results for expected frequency to the nearest integer. No credit will considered for decimal numbers. Show me all of your work. b. Compute the value of the chi-square statistic. C. How many degrees of freedom are there? ( d. Write the hypothesis test and test the hypothesis of independence. Use an a = 0.01 level of significance. What do you conclude? Use your table of statistical values for the relevant information
Step by Step Solution
There are 3 Steps involved in it

Get step-by-step solutions from verified subject matter experts