

Question: please explain step by step the highlighted part Insert a pie chart (2-D Pie) to show the Old Bay sales for the month by location.
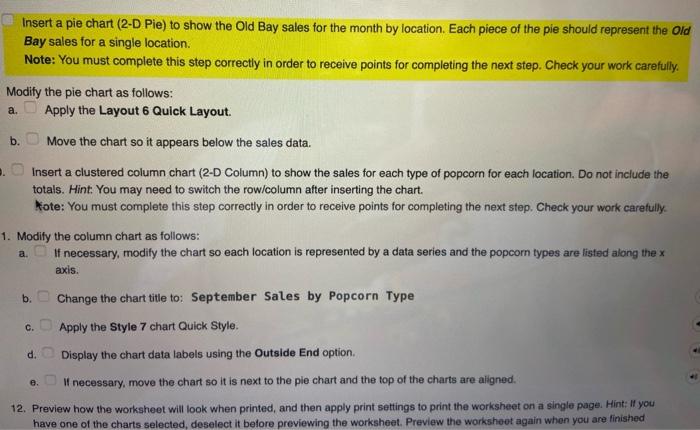
Insert a pie chart (2-D Pie) to show the Old Bay sales for the month by location. Each piece of the pie should represent the Old Bay sales for a single location. Note: You must complete this step correctly in order to receive points for completing the next step. Check your work carefully. Modify the pie chart as follows: a. Apply the Layout 6 Quick Layout. b. Move the chart so it appears below the sales data. Insert a clustered column chart (2-D Column) to show the sales for each type of popcorn for each location. Do not include the totals. Hint: You may need to switch the row/column after inserting the chart. Kote: You must complete this step correctly in order to receive points for completing the next step. Check your work carefully. 1. Modify the column chart as follows: a. If necessary, modify the chart so each location is represented by a data series and the popcom types are lisfed along the x axis. b. Change the chart title to: September Sales by Popcorn Type c. Apply the Style 7 chart Quick Style. d. Display the chart data labels using the Outside End option. e. If necessary, move the chart so it is next to the pie chart and the top of the charts are ailgned. 12. Preview how the worksheet will look when printed, and then apply print settings to print the worksheet on a single page. Hint: It you have one of the charts selected, deselect it belore previewing the worksheet. Preview the workshoet again when you are linished
Step by Step Solution
There are 3 Steps involved in it

Get step-by-step solutions from verified subject matter experts