

Question: Please explain, thank you A quality inspector counted the number of defective monthly billing statements produced by a telephone company in each of 14 samples
Please explain, thank you 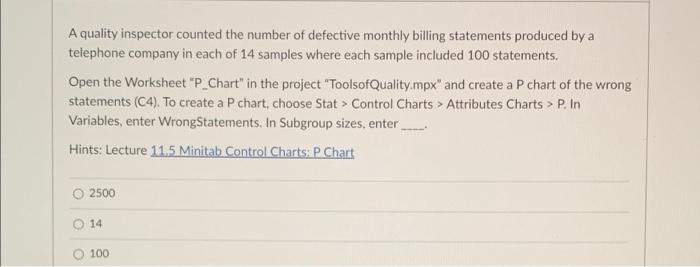
A quality inspector counted the number of defective monthly billing statements produced by a telephone company in each of 14 samples where each sample included 100 statements. Open the Worksheet "P_Chart" in the project "Toolsof Quality.mpx" and create a P chart of the wrong statements (C4). To create a P chart, choose Stat > Control Charts > Attributes Charts > P. In Variables, enter WrongStatements. In Subgroup sizes, enter Hints: Lecture 11,5 Minitab Control Charts: P Chart 2500 14 100
Step by Step Solution
There are 3 Steps involved in it
1 Expert Approved Answer
Step: 1 Unlock

Question Has Been Solved by an Expert!
Get step-by-step solutions from verified subject matter experts
Step: 2 Unlock
Step: 3 Unlock