

Question: please explain. Thank you Figure 1: 4 box plot or box-and-whisker plot graphs presenting mental health metrics collected through surveying several medical students. Mental health
please explain. Thank you
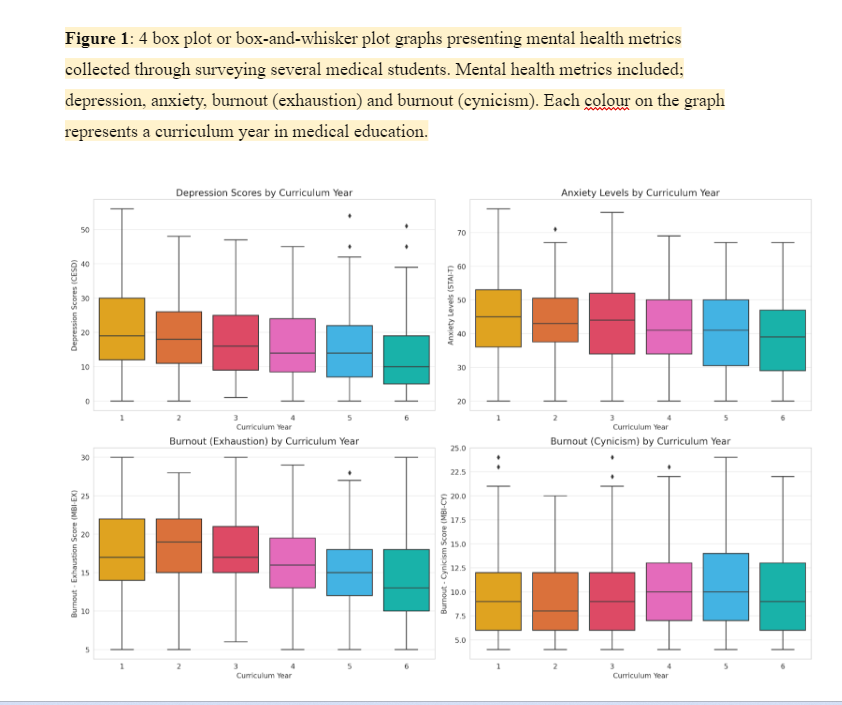
Figure 1: 4 box plot or box-and-whisker plot graphs presenting mental health metrics collected through surveying several medical students. Mental health metrics included; depression, anxiety, burnout (exhaustion) and burnout (cynicism). Each colour on the graph represents a curriculum year in medical education. Depression Scores by Curriculum Year Anxiety Levels by Curriculum Year 50 70 40 Depression Scores (CESD) Anxiety Levels (5TAI-T) 10 30 20 Curriculum Year Curriculum Year Burnout (Exhaustion) by Curriculum Year 25.0 Bumout (Cynicism) by Curriculum Year 30 22.5 20.0 $ 17.5 20 * 15.0 Burnout - Exhaustion Score (MEI-EX) 12.5 Burnout - Cynicism 10.0 10 7.5 5.0 Curriculum Year Curriculum Year
Step by Step Solution
There are 3 Steps involved in it

Get step-by-step solutions from verified subject matter experts