

Question: Please explain thanks! Calculate the 95% prediction intervals for the four different investments included in the following table. Average Return Standard Deviation of returns Small
Please explain thanks!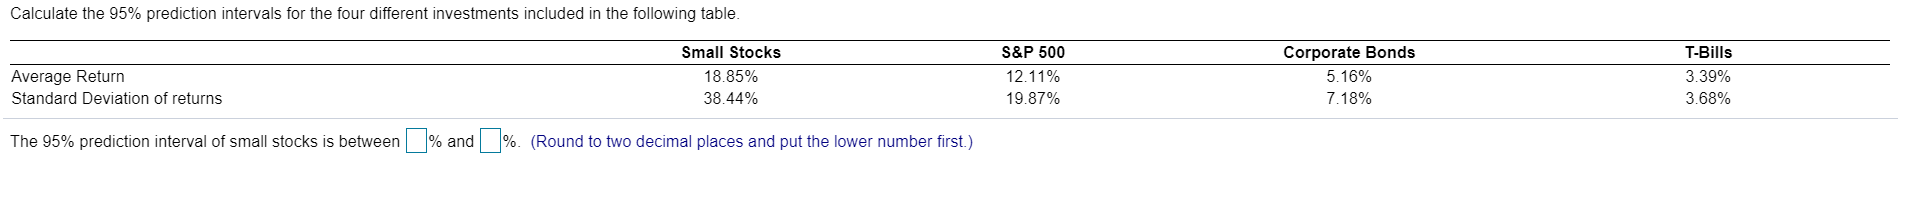
Calculate the 95% prediction intervals for the four different investments included in the following table. Average Return Standard Deviation of returns Small Stocks 18.85% 38.44% S&P 500 12.11% 19.87% Corporate Bonds 5.16% 7.18% T-Bills 3.39% 3.68% The 95% prediction interval of small stocks is between % and %. (Round to two decimal places and put the lower number first.)
Step by Step Solution
There are 3 Steps involved in it
1 Expert Approved Answer
Step: 1 Unlock

Question Has Been Solved by an Expert!
Get step-by-step solutions from verified subject matter experts
Step: 2 Unlock
Step: 3 Unlock