

Question: Please explain The following ACF plot shows (the dotted line is the statistical threshold, inside the dotted line can be viewed as no statistically significant

Please explain
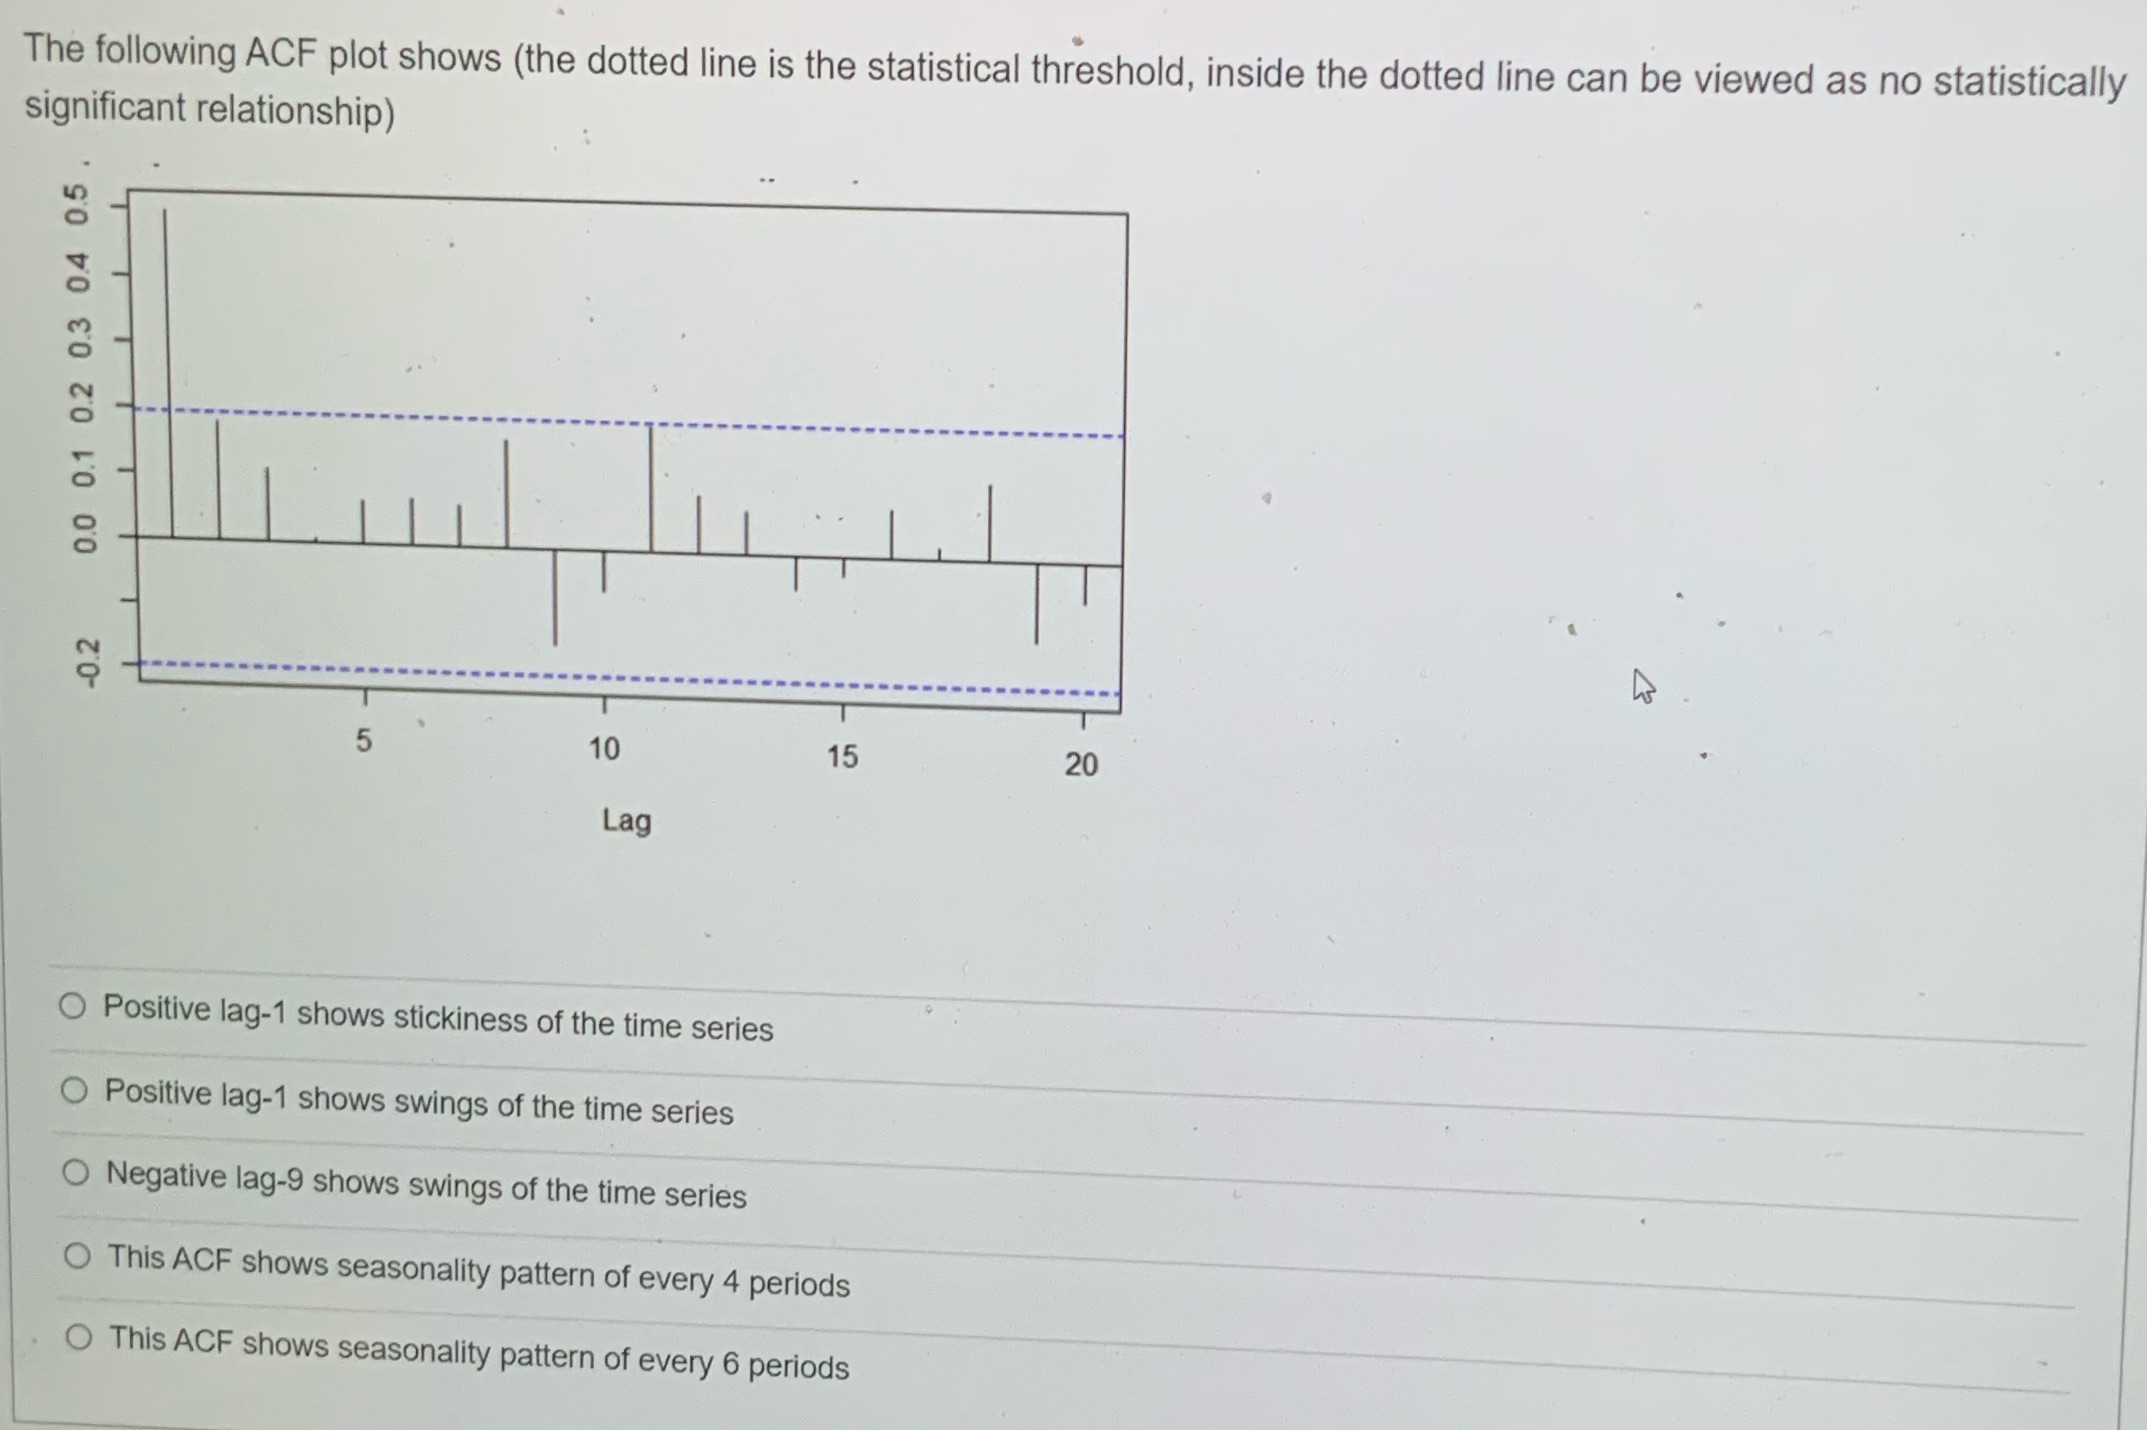
The following ACF plot shows (the dotted line is the statistical threshold, inside the dotted line can be viewed as no statistically significant relationship) 0.0 0.1 0.2 0.3 0.4 0.5 -0.2 5 10 15 20 Lag Positive lag-1 shows stickiness of the time series O Positive lag-1 shows swings of the time series O Negative lag-9 shows swings of the time series O This ACF shows seasonality pattern of every 4 periods O This ACF shows seasonality pattern of every 6 periods
Step by Step Solution
There are 3 Steps involved in it
1 Expert Approved Answer
Step: 1 Unlock

Question Has Been Solved by an Expert!
Get step-by-step solutions from verified subject matter experts
Step: 2 Unlock
Step: 3 Unlock