

Question: Please explain this chart for me... What is it saying about the Food Processing and Instruments segments of the company? Part Three Estimating the Cost
Please explain this chart for me... What is it saying about the Food Processing and Instruments segments of the company? 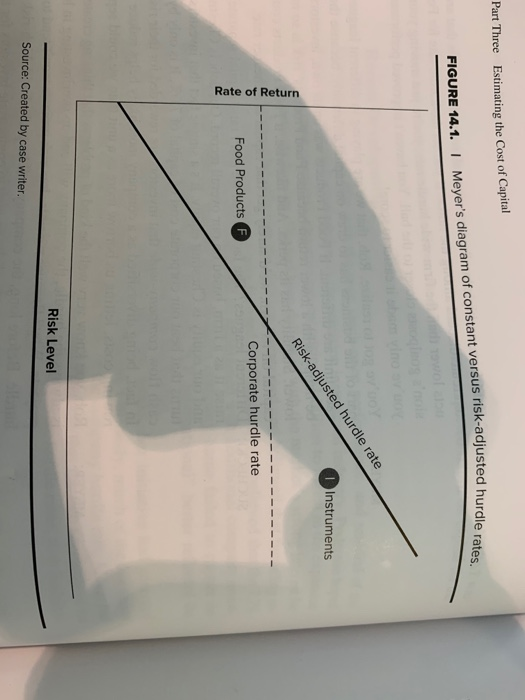
Part Three Estimating the Cost of Capital adjusted hurdle rates. FIGURE 14.1. Meyer's diagram of constant versus risk-adjusted hurdle Instruments Risk-adjusted hurdle rate Rate of Return Corporate hurdle rate Food Products Risk Level Source: Created by case writer
Step by Step Solution
There are 3 Steps involved in it
1 Expert Approved Answer
Step: 1 Unlock

The chart you provided is a diagram showing the relationship between risk levels and the rate of ret... View full answer
Question Has Been Solved by an Expert!
Get step-by-step solutions from verified subject matter experts
Step: 2 Unlock
Step: 3 Unlock