

Question: please explain this with R code. 1. Question 1 [10 +5 points): [1] Use 'sample' function to generate a random vector of size 100 that
please explain this with R code.
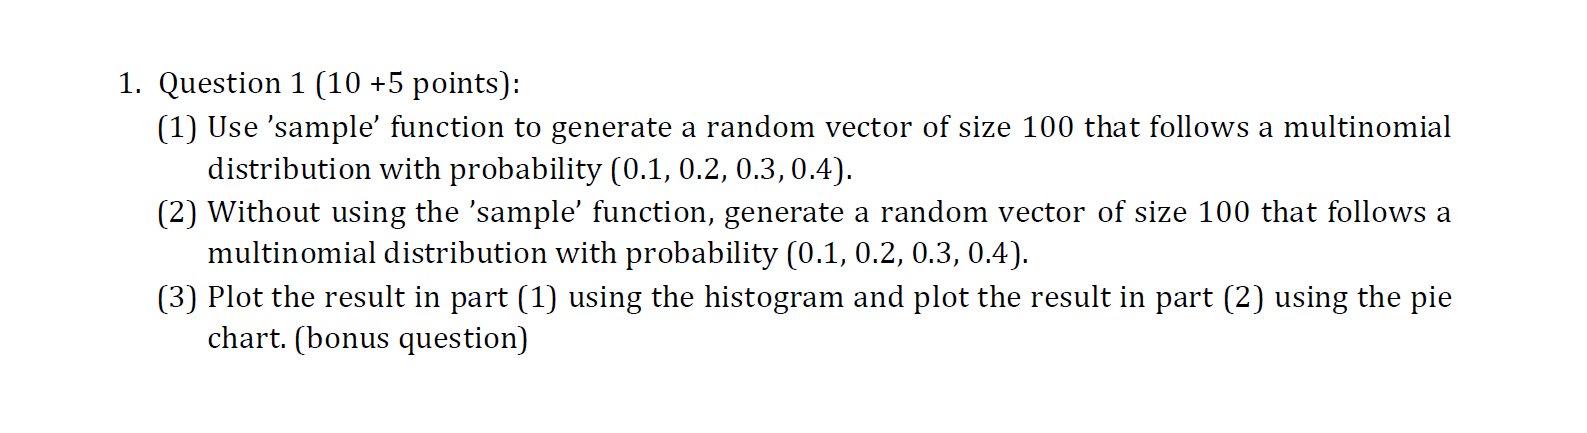
1. Question 1 [10 +5 points): [1] Use 'sample' function to generate a random vector of size 100 that follows a multinomial distribution with probability [0.1, 0.2, 0.3, 0.4). [2] Without using the 'sample' function, generate a random vector of size 100 that follows a multinomial distribution with probability [0.1, 0.2, 0.3, 0.4]. [3) Plot the result in part [1) using the histogram and plot the result in part [2) using the pie chart. [bonus question)
Step by Step Solution
There are 3 Steps involved in it
1 Expert Approved Answer
Step: 1 Unlock

Question Has Been Solved by an Expert!
Get step-by-step solutions from verified subject matter experts
Step: 2 Unlock
Step: 3 Unlock