

Question: please explain through Excel steps taking. 3. Suppose you are preparing a data set for CER development. Complete the table below: expressing all historical data
 please explain through Excel steps taking.
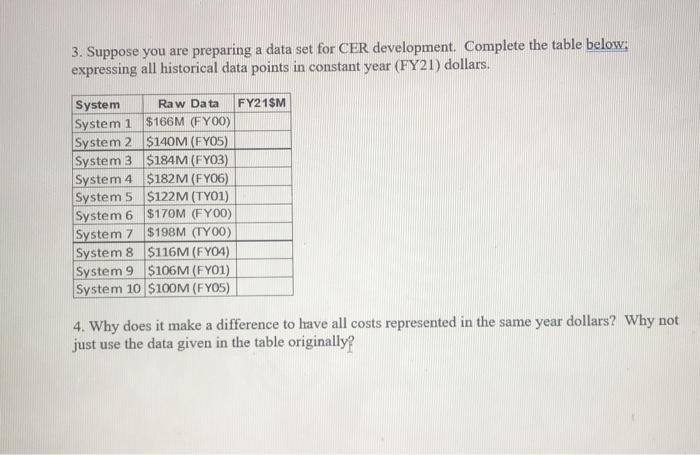
3. Suppose you are preparing a data set for CER development. Complete the table below: expressing all historical data points in constant year (FY21) dollars. System Raw Data FY21SM System 1 $166M (FY00) System 2 $140M (FYO5) System 3 $184M (FYO3) System 4 $182M (FY06) System 5 $122M (TY01) System 6 $170M (FY00) System 7 $198M (TY00) System 8 $116M (FYO4) System 9 $106M (FY01) System 10 $100M (FYOS) 4. Why does it make a difference to have all costs represented in the same year dollars? Why not just use the data given in the table originally? 3. Suppose you are preparing a data set for CER development. Complete the table below: expressing all historical data points in constant year (FY21) dollars. System Raw Data FY21SM System 1 $166M (FY00) System 2 $140M (FYO5) System 3 $184M (FYO3) System 4 $182M (FY06) System 5 $122M (TY01) System 6 $170M (FY00) System 7 $198M (TY00) System 8 $116M (FYO4) System 9 $106M (FY01) System 10 $100M (FYOS) 4. Why does it make a difference to have all costs represented in the same year dollars? Why not just use the data given in the table originally
Step by Step Solution
There are 3 Steps involved in it

Get step-by-step solutions from verified subject matter experts