Question: please explain what to do on EXCEL for each question in detail. preferably the equations to put in each cell You have access to CEO
please explain what to do on EXCEL for each question in detail. preferably the equations to put in each cell
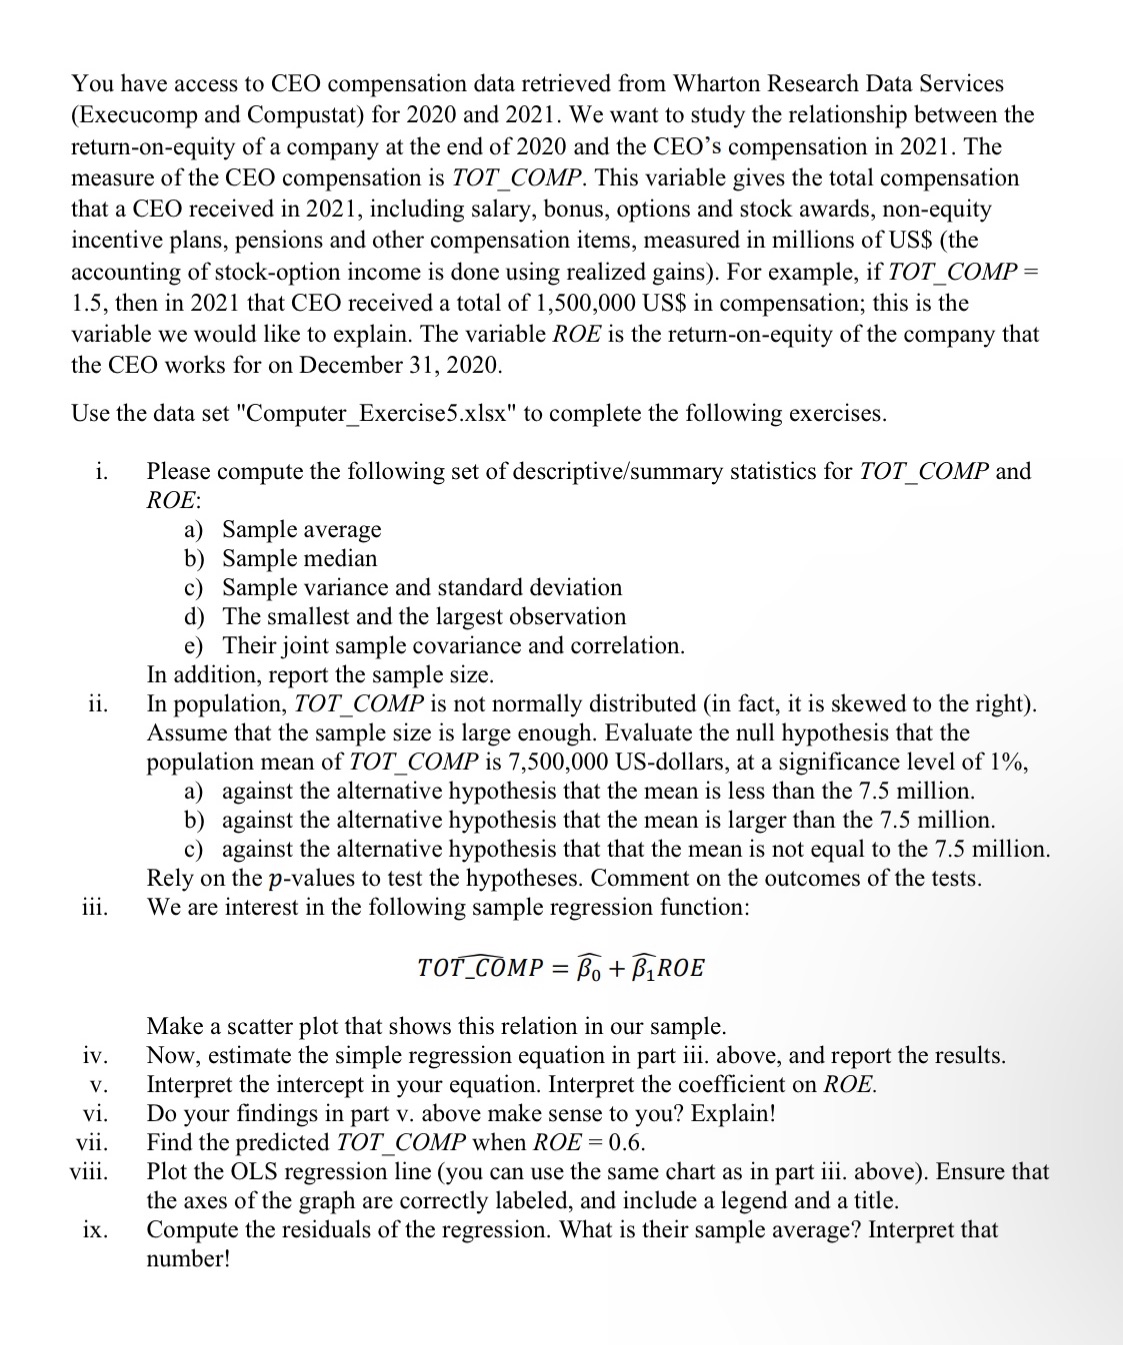
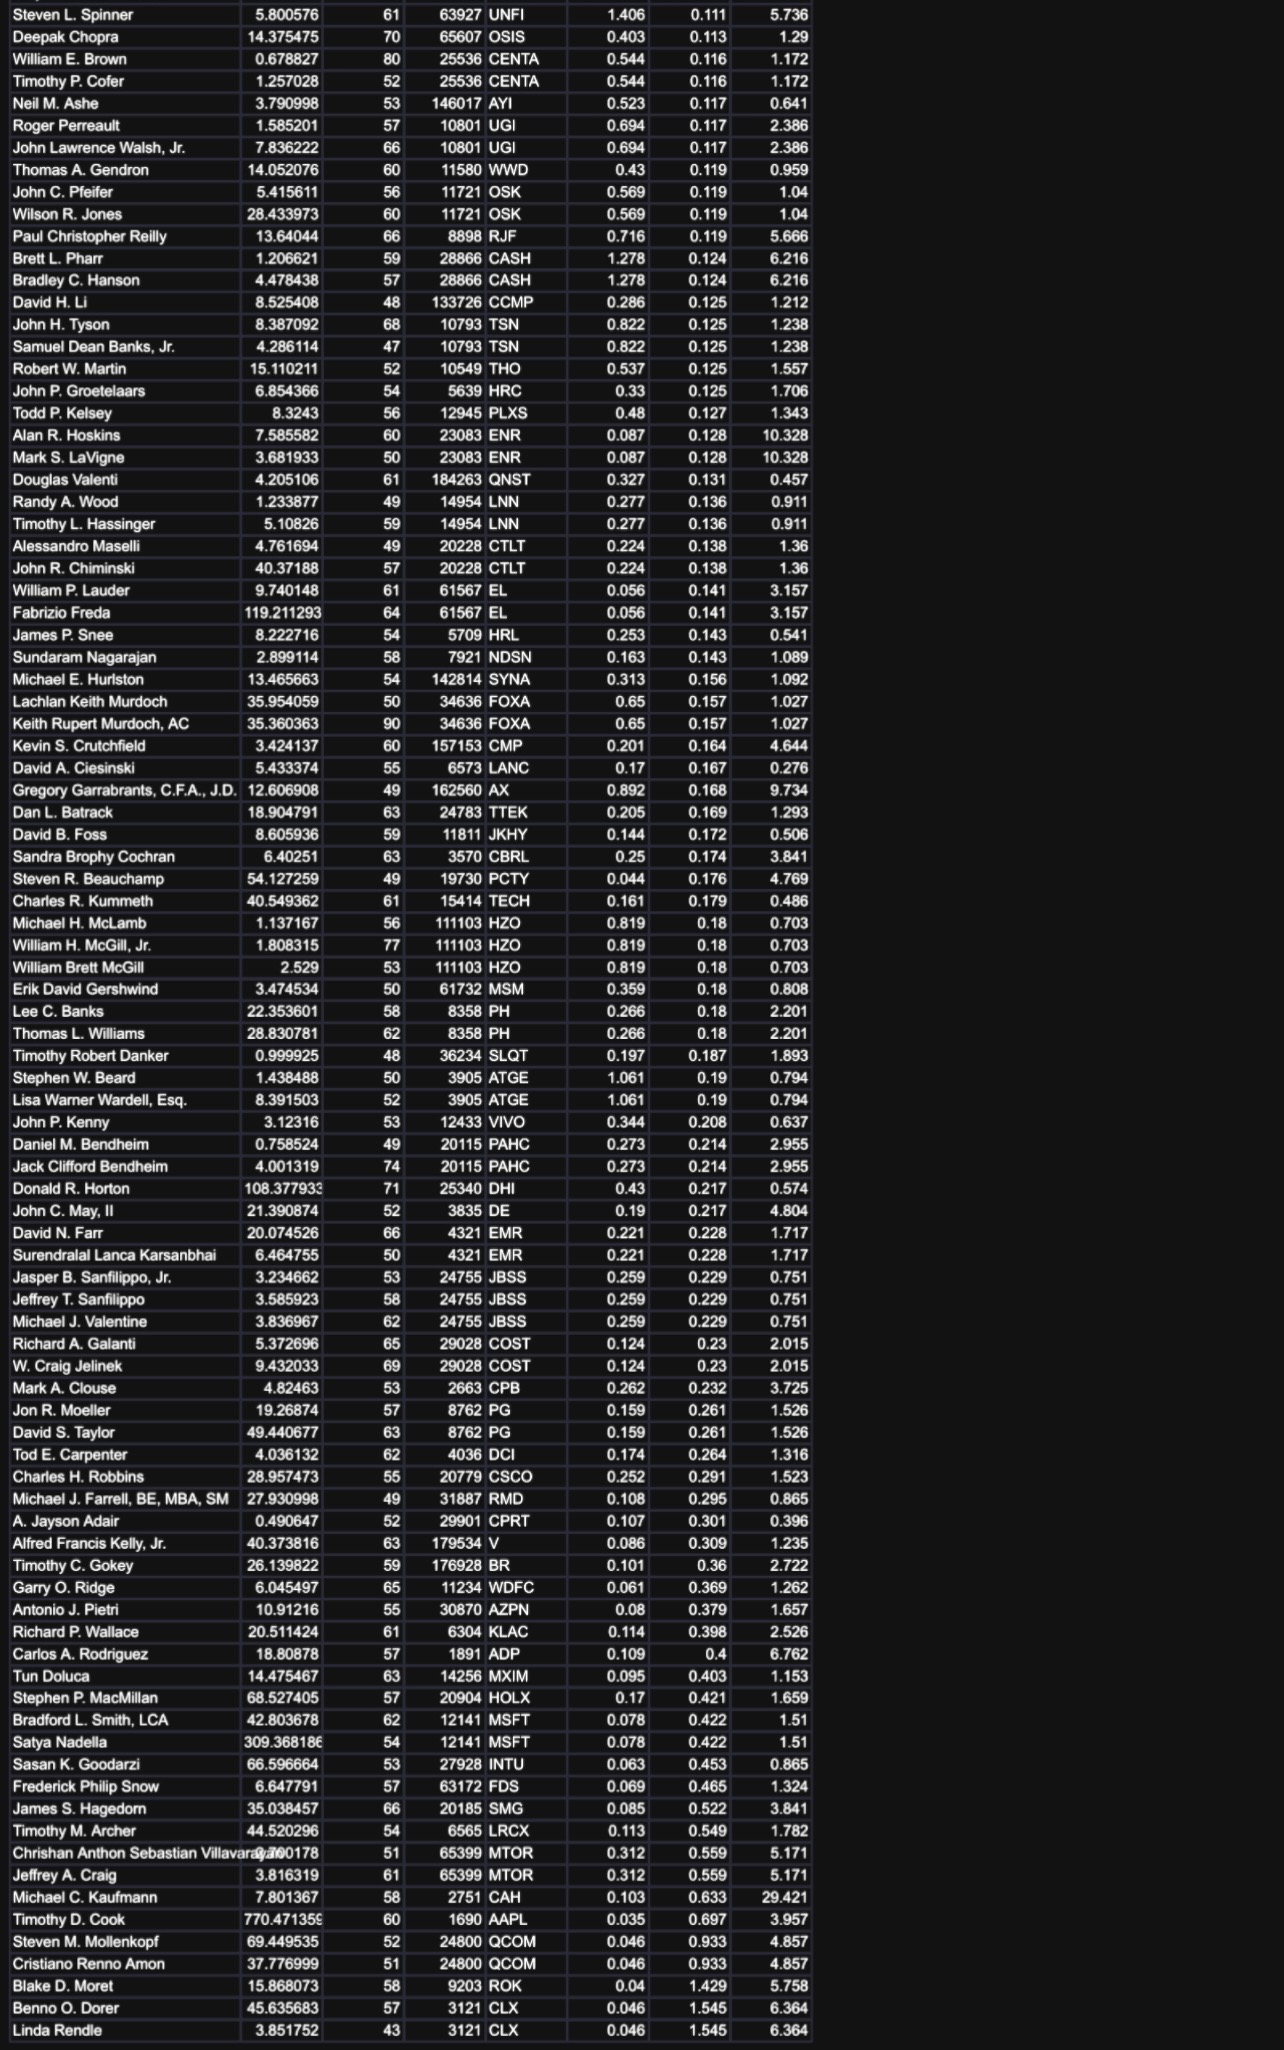
You have access to CEO compensation data retrieved from Wharton Research Data Services (Execucomp and Compustat) for 2020 and 2021. We want to study the relationship between the return-on-equity ofa company at the end ot'2020 and the CEO'S compensation in 2021. The measure of the CEO compensation is TOT_COMP. This variable gives the total compensation that a CEO received in 2021, including salary, bonus, options and stock awards, non-equity incentive plans, pensions and other compensation items, measured in millions ofUS$ (the accounting ot'stock-option income is done using realized gains). For example, if TOT_COMP = 1.5, then in 2021 that CEO received a total of 1,500,000 USS in compensation; this is the variable we would like to explain. The variable ROE is the retum-on-equity of the company that the CEO works for on December 31, 2020. Use the data set \"Computer_Exercise5.xlsx" to complete the following exercises. i. Please compute the following set of descriptive/summary statistics for TOT_COMP and ROE: a) Sample average b) Sample median c) Sample variance and standard deviation d) The smallest and the largest observation e) Their joint sample covariance and correlation. In addition, report the sample size. ii. In population, TOT_COMP is not normally distributed (in fact, it is skewed to the right). Assume that the sample size is large enough. Evaluate the null hypothesis that the population mean of TOT_COMP is 7,500,000 US-dollars, at a signicance level of 1%, a) against the alternative hypothesis that the mean is less than the 2.5 million. b) against the alternative hypothesis that the mean is larger than the 2.5 million. 0) against the alternative hypothesis that that the mean is not equal to the 7.5 million. Rely on the p-values to test the hypotheses. Comment on the outcomes of the tests. iii. We are interest in the following sample regression function: Tomi/u) = Z3"; + EROE Make a scatter plot that shows this relation in our sample. iv. Now, estimate the simple regression equation in part iii. above, and report the results. v. Interpret the intercept in your equation. Interpret the coefficient on ROE. vi. Do your ndings in part v. above make sense to you? Explain! vii. Find the predicted T 01" _C 0MP when ROE = 0.6. viii. Plot the OLS regression line (you can use the same chart as in part iii. above). Ensure that the axes ofthe graph are correctly labeled, and include a legend and a title. ix. Compute the residuals of the regression. What is their sample average? Interpret that number! \fCross-sectional data set (unit of observation = CEO) from 2021 EXEC_FULLNAME Name of CEO TOT COMP Total compensation that a CEO received, including salary, bonus, options and stock awards, non-equity incentive plans, pensions millions AGE Age of CEO GVKEY Company identifier TICKER Company ticker symbol B/M Book-to-market ratio of CEO's company ROF Return on equilty of CEO's company D/E debt-to-equity ratio of CEO's company EXEC_FULLNAME TOT_COMRGE GVKEY TICKER B/M ROE D/E Edward B. Meyercord, Ill 7.539483 56 119574 EXTR 0.025 -2.233 46.518 Hugh E. Sawyer, I 2.07018 66 9023 RGS 0.409 -0.863 7.205 Felipe A. Athayde 3.776526 42 9023 RGS 0.409 -0.863 7.205 Mark Charles Borrecco 1.926658 50 21616 GWB 1.698 -0.445 9.838 Andreas Walter Mattes 4.892492 3157 COHR 0.35 -0.367 0.971 Elazar Rabbani, Ph.D. 0.808621 28 8 8 8 4418 ENZ 0.677 -0.305 0.832 Warren G. Lichtenstein D.1245 29621 STCN 1.315 -0.266 8.21 Peter Andrew Reed 0.458656 121257 GEG 0.95 -0.234 2.115 Sue Y. Nabi 3.591455 12151 COTY 1.781 -0.223 3.293 Thomas H. Caudle, Jr. 1.776543 8 8 892 10839 UFI 1.354 -0.159 0.541 Albert P. Carey 0.7 10839 UFI 1.354 -0.159 0.541 Edmund M. Ingle 1.748373 10839 UFI -0.159 0.541 Thomas H. Harty 5.109965 7260 MDP 1.533 -0.149 5.646 Jide J. Zeitlin 140541 TPR 0.604 -0.146 2.043 Joanne C. Crevoiserat 5.831631 140541 TPR 0.604 -0.146 2.043 Scott Raymond Ward, B.Sc., M.S., M$653946 179413 CSII 0.135 0.366 John R. Hewitt 1.686148 23195 MTRX 1.385 -0.13 0.754 Sunny S. Sanyal 2.187789 29004 VREX 0.914 -0.128 1.491 Robert A. Whitman 8.084542 67 25331 FC 0.236 -0.128 2.455 Robert J. Thomson 21.235524 18043 NWSA 0.954 -0.118 0.745 Gregg A. Lowe 25.663687 27794 WOLF 0.272 -0.117 0.496 Joseph C. Bartolacci 4.052118 30477 MATW 0.969 -0.115 2.392 Michael J. Sheen 0.365328 98 8 89 8 8 65896 GEOS 1.906 -0.113 0.161 Walter Richard Wheeler 0.3859 65896 GEOS 1.906 -0.113 0.161 John W. Lindsay 1.001075 5581 HP 2.521 -0.113 0.455 Michael L. Baur 3.640543 29910 SCSC 1.343 -0.107 1.428 Phillip Ean Cohen, B.Com., M.B.A. 3.179576 24430 EZPW 2.335 -0.098 0.844 Jason A. Kulas 2.996959 50 24430 EZPW 2.335 -0.098 0.844 Timothy C. Crew 1.299926 60 22632 LCI 1.244 -0.088 2.723 George L. Holm 5.266138 28787 PFGC 0.469 -0.087 3.07 Kimberly K. Ryan 2.065399 179657 HI 0.587 -0.058 2.746 Joe A. Raver 7.236301 89848 179657 HI 0.587 -0.058 2.746 Steven C. Voorhees 15.836988 29830 WRK -0.049 1.706 David B. Sewell 2.292709 29830 WRK .498 -0.049 1.706 David P. Bauer 4.226319 52 7733 NFG 0.723 -0.045 2.532 Robert A. Chapek 21.767103 3980 DIS 0.405 -0.03 1.245 Robert A. Iger 245.62347 3980 DIS 0.405 -0.03 1.245 Christopher Ross 4.518792 6386 KMT 0.518 -0.026 Michael L. Shor 1.991613 23587 HAYN 1.408 -0.022 0.86 Stefan Ortmanns 10.232663 35614 CRNC 0.532 -0.02 0.762 Sanjay Dhawan 28.577989 35614 CRNC 0.532 -0.02 0.762 Robert A. Eberle 6.971158 118223 EPAY 0.24 -0.019 0.935 Kevin P. Hourican 4.041893 10247 SYY 0.043 -0.01 11.123 David V. Goeckeler 12.005255 59 11399 WDC 0.862 -0.004 1.714 Samuel J. Mitchell, Jr 5.310717 60 27373 VW 41.145 William C. Rhodes, III 45.243462 23809 AZO -17.429 Brian Matthew Krzanich 9.354728 21761 CDK -5.834 Wyman T. Roberts 11.383158 3007 EAT -5.685 Robert V. Vitale 57.902869 170527 POST 0.637 3.264 Christian A. Brickman 3.158185 175900 SBH 0.11 186.473 Vincent D. Mattera, Jr., Ph.D. 18.33645 14561 IIVI 0.631 0.002 1.283 John R. Scannell 3.864688 7549 MOG.A 0.628 0.007 1.595 Gary R. Maharaj 4.354631 66588 SRDX 0.246 0.009 0.288 M. Farooq Kathwari 3.351924 23252 ETD 0.982 0.012 0.886 Mark L. Schiller 3.741268 29609 HAIN 0.425 0.013 0.525 Stefano Pessina 4.303603 N8 8 8 11264 WBA 0.673 0.019 3.2 James A. Skinner 3.513609 11264 WBA 0.673 0.019 3.2 Rosalind Gates Brewer 8.13345 11264 WBA 0.673 0.019 Robert M. Radano 0.661035 12825 JJSF 0.354 0.021 0.305 Gerald B. Shreiber 0.000699 12825 JJSF 0.354 0.021 0.305 Ronald E. Konezny 2.2717 16710 DGII 0.853 0.023 0.423 Gary E. Muenster 3.132361 23224 ESE 0.487 0.027 0.428 Victor L. Richey, Jr 1.698897 23224 ESE 0.487 0.027 0.428 Mark T. Mondello 7.219191 28195 JBL 0.375 0.027 6.941 David Wayne Ritterbush 1.817308 27576 SMPL 0.554 0.031 0.629 Joseph E. Scalzo 2.361099 27576 SMPL 0.554 0.031 0.629 Suzanne Sitherwood 3.910487 6547 SR 0.929 0.035 2.068 William A. Furman 4.849569 30463 GBX 1.463 0.038 1.291 Rod R. Little 3.074577 133367 EPC 1.013 0.046 1.471 Oleg Khaykin 7.238498 29241 VIAV 0.289 0.049 1.491 W. Troy Rudd 6.124952 8 8 8 8 8 147988 ACM 0.502 0.049 2.911 John B. Dicus 1.215079 119414 CFFN 1.03 0.049 6.384 Stephen S. Schwartz 6.677579 31477 AZTA 0.361 0.054 0.285 Brett A. Cope 2.206588 8699 POWL 1.094 0.055 0.54 Jerome A. Grant 1.431068 156633 UTI 1.068 0.055 1.504 Steven J. Demetriou 27.825944 6216 J 0.483 0.06 1.117 Mark Aslett 7.338833 66393 MRCY 0.333 0.061 0.199 Fusen Ernie Chen 5.222359 6509 KLIC 0.574 0.066 0.391 Sanjay Mehrotra 36.040378 7343 MU 0.77 0.072 0.377 Donald J. Tomnitz 2.319797 79077 FOR 1.03 0.072 0.997 Howard Osler Woltz, Ill 3.324389 4498 IIIN 0.752 0.073 0.276 Ole G. Rosgaard 1.890944 5338 GEF 0.758 0.074 3.723 Peter G. Watson 7.215653 5338 GEF 0.758 0.074 3.723 Gregory Eugene Johnson, CPA, CP/5.752147 4885 BEN 1.034 0.078 0.861 Jennifer M. Johnson 8.175728 4885 BEN 1.034 0.078 0.861 John Kevin Akers 4.42081 4383 ATO 0.685 0.079 1.262 Cynthia Croatti 1.791952 10840 UNF 0.478 0.08 0.263 Steven S. Sintros 3.124653 10840 UNF 0.478 0.08 0.263 Charles Liang 11.451215 176567 SMC 0.785 0.083 0.796 Michael J. Happe 4.003532 11537 WGO 0.464 0.083 1.071 David A. Dunbar 2.847353 10008 SXI 0.66 0.085 1.004 Brent J. Beardall, CPA 2.417155 17145 WAFD 1.276 0.085 8.331 Robert F. Mehmel 3.325348 5987 GFF 0.669 0.086 2.508 Ronald J. Kramer 10.097058 5987 GFF 0.669 0.086 2.508 Alan S. Lowe 11.582797 23249 LITE 0.329 0.09 0.887 Allan P. Merrill 6.825896 29755 BZH 1.449 0.094 2.384 Sherry S. Bahrambeygu 8.088867 65343 PSMT 0.413 0.096 0.991 James E. Heppelmann 1.920754 18699 PTC 0.151 0.097 1.352 William H. Heissenbuttel 1.893386 9273 RGLD 0.309 0.102 0.164 Stephen D. Westhoven 3.651885 7849 NJR 0.786 0.102 2.019