

Question: please explain which one is correct and explain why the other answers are incorrect The table below shows a partial one-way ANOVA table for the
please explain which one is correct and explain why the other answers are incorrect
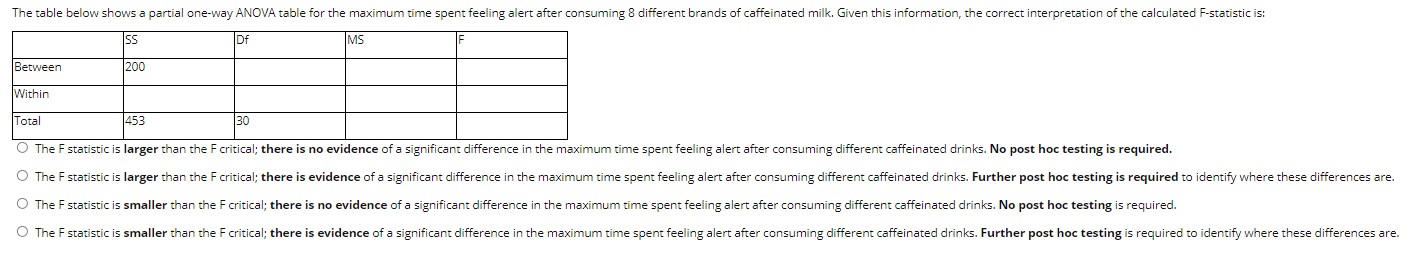
The table below shows a partial one-way ANOVA table for the maximum time spent feeling alert after consuming 8 different brands of caffeinated milk. Given this information, the correct interpretation of the calculated F-statistic is: SS Of MS Between 200 Within ota 453 30 The F statistic is larger than the F critical; there is no evidence of a significant difference in the maximum time spent feeling alert after consuming different caffeinated drinks. No post hoc testing is required. The F statistic is larger than the F critical; there is evidence of a significant difference in the maximum time spent feeling alert after consuming different caffeinated drinks. Further post hoc testing is required to identify where these differences are. The F statistic is smaller than the F critical; there is no evidence of a significant difference in the maximum time spent feeling alert after consuming different caffeinated drinks. No post hoc testing is required. The F statistic is smaller than the F critical; there is evidence of a significant difference in the maximum time spent feeling alert after consuming different caffeinated drinks. Further post hoc testing is required to identify where these differences are
Step by Step Solution
There are 3 Steps involved in it

Get step-by-step solutions from verified subject matter experts