

Question: please explain which one is correct and explain why the other answers are incorrect A one-way ANOVA was investigated to identify whether there was a
please explain which one is correct and explain why the other answers are incorrect
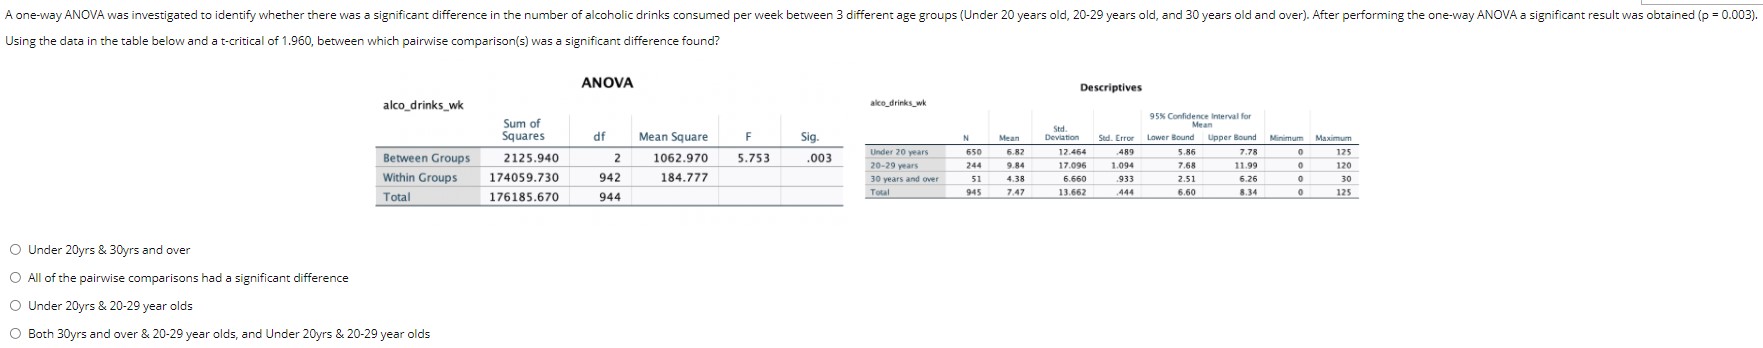
A one-way ANOVA was investigated to identify whether there was a significant difference in the number of alcoholic drinks consumed per week between 3 different age groups (Under 20 years old, 20-29 years old, and 30 years old and over). After performing the one-way ANOVA a significant result was obtained (p = 0.003) Using the data in the table below and a t-critical of 1.960, between which pairwise comparison(s) was a significant difference found? ANOVA Descriptives alco_drinks_wk ako_drinks_wk Sum of 95% Confidence Interval for Sed Mean Squares df Mean Square Sig. N Mean Deviation Sed. Error Lower Bound Upper Bound Minimum Maximum 6.82 Between Groups 2125.940 1062.970 5.753 003 Under 20 years 650 12.464 .489 5.86 7.78 125 20-29 years 244 17.09 1.094 7.68 1.99 120 Within Groups 174059.730 942 184.777 30 years and over 51 4.38 6.660 .933 2.51 6.26 30 Total 945 176185.670 747 444 944 Total 13.662 6.60 8.34 O Under 20yrs & 30yrs and over O All of the pairwise comparisons had a significant difference O Under 20yrs & 20-29 year olds O Both 30yrs and over & 20-29 year olds, and Under 20yrs & 20-29 year olds
Step by Step Solution
There are 3 Steps involved in it

Get step-by-step solutions from verified subject matter experts