

Question: Please explain why N(T)=6? how do you get it from the graph? (c) Based on information provided in Figure 3, calculate the three outputs below:
Please explain why N(T)=6? how do you get it from the graph? 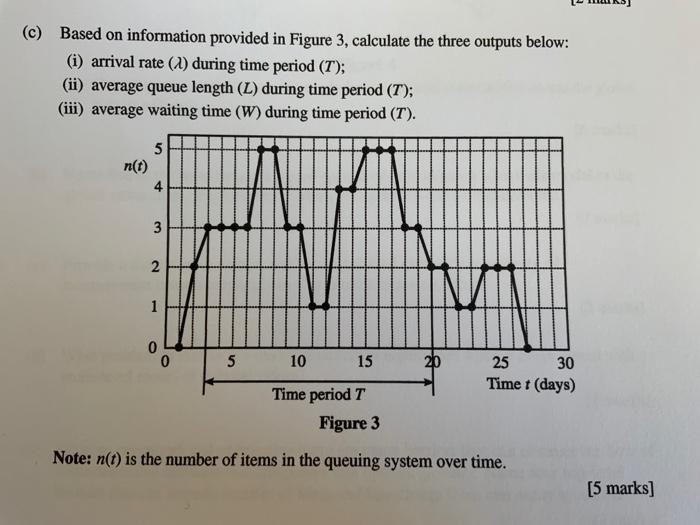
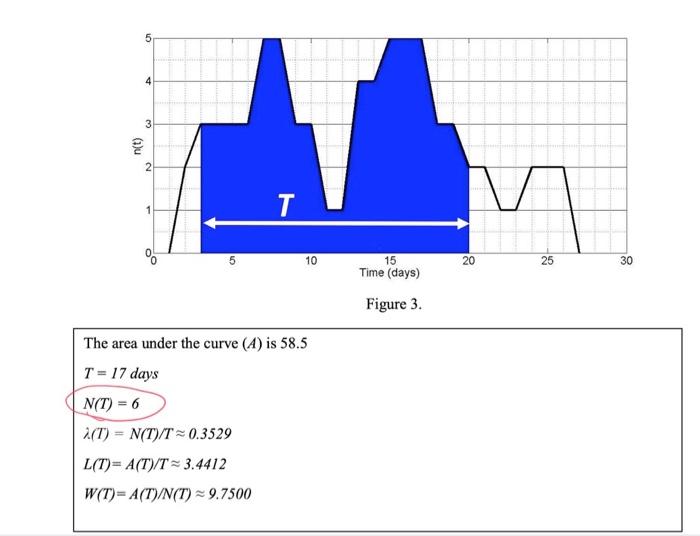
(c) Based on information provided in Figure 3, calculate the three outputs below: (i) arrival rate (2) during time period (T); (ii) average queue length (L) during time period (T); (iii) average waiting time (W) during time period (T). 5 n(t) 4 3 Y 2 1 1 0 0 5 10 15 20 25 30 Time t (days) Time period T Figure 3 Note: n(t) is the number of items in the queuing system over time. (5 marks] 5 4 3 Glu 2 T M 5 10 20 25 30 15 Time (days) Figure 3. The area under the curve (A) is 58.5 T = 17 days N(T) = 6 2(T) = N(T)/T=0.3529 L(T)= A(T)/T = 3.4412 W(T) = A(T)/N(T) = 9.7500 Step by Step Solution
There are 3 Steps involved in it
1 Expert Approved Answer
Step: 1 Unlock

Question Has Been Solved by an Expert!
Get step-by-step solutions from verified subject matter experts
Step: 2 Unlock
Step: 3 Unlock