

Question: please explain with formulas how i can get revenue 1 year growth rate and Net Income 1 year growth and earning per share(EPS) -diluted 7
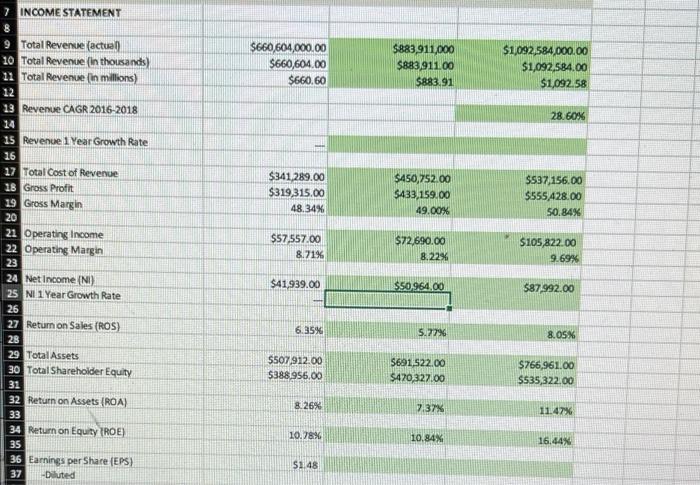
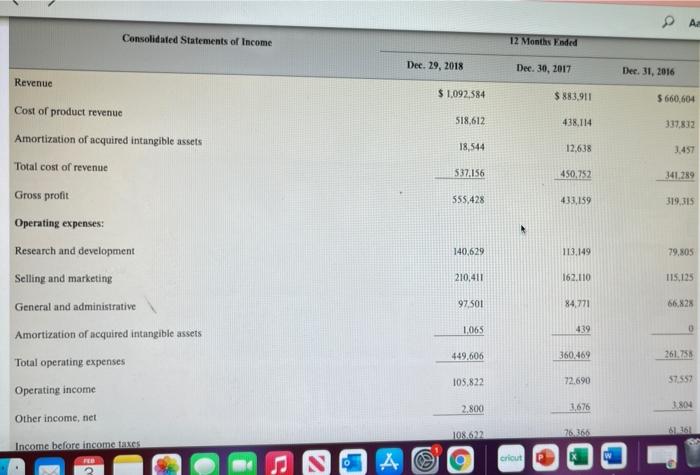
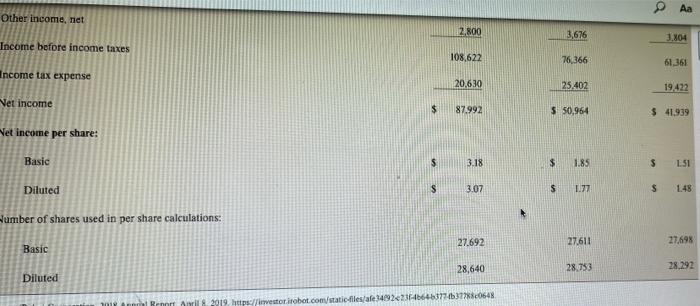
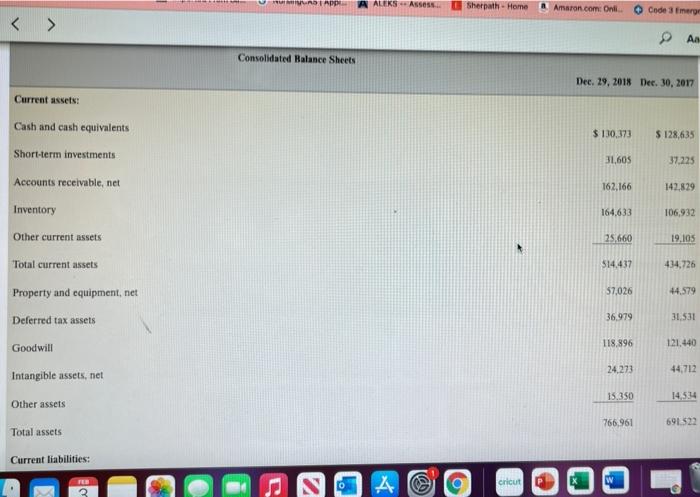
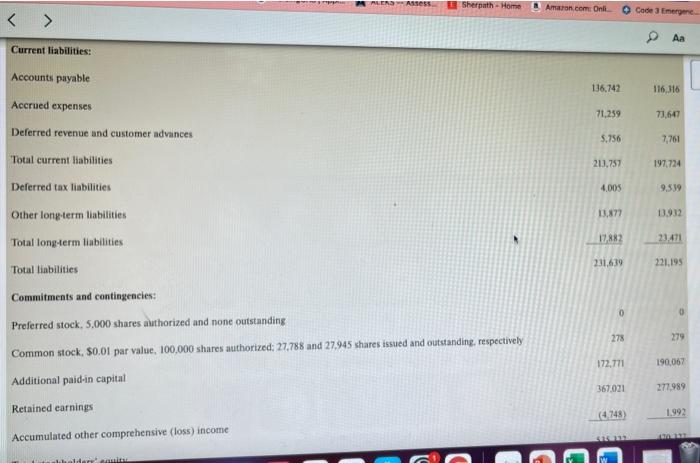
7 INCOME STATEMENT $660,604,000.00 $660,604.00 $660.60 $883,911,000 $883,911.00 5883.91 $1,092,584,000.00 $1,092,584.00 $1,092.58 28. 60% $341,289.00 $319,315.00 48.34% $450,752.00 $433 159.00 49.00% $537,156.00 $555 428.00 50.84% 9 Total Revenue (actual, 10 Total Revenue (In thousands) 12 Total Revenue in millions) 12 13 Revenue CAGR 2016-2018 14 15 Revenue 1 Year Growth Rate 16 17 Total Cost of Revenue 18 Gross Profit 19 Gross Margin 20 21 Operating Income 22 Operating Margin 23 24 Net Income (NI) 25 NI 1 Year Growth Rate 26 27 Return on Sales (ROS) 28 29 Total Assets 30 Total Shareholder Equity 31 32 Return on Assets(ROA) 33 34 Return on Equity (ROE) 35 36 Earnings per Share (EPS) 37 -Diluted $57,557.00 8.71% $72,690.00 8.22% $105,822.00 9.69% $41,939.00 $50964,00 587,992.00 6.35% 5.27% 8.05X $507912.00 $388.956.00 S691,522.00 $420,327.00 $766,961.00 $535,322.00 8.26% 7.37% 11.47% 10.78% 10.84% 16.44% 51.48 & A Consolidated Statements of Income 12 Months Ended Dec. 29, 2018 Dec. 30, 2017 Der 31, 2016 Revenue $ 1.092,584 $883.911 $ 660,604 518,612 438,114 337.833 Cost of product revenue Amortization of acquired intangible assets Total cost of revenue 18,544 12.638 3.457 537.156 450,752 341.289 Gross profit 555,428 433,159 319.315 140,629 113.149 79,805 210,411 162.110 115.125 97.501 84,771 66.82% Operating expenses: Research and development Selling and marketing General and administrative Amortization of acquired intangible assets Total operating expenses Operating income Other income, net 1.065 439 0 449,606 360,469 261.758 105.822 72.690 57 557 2.800 3.676 3804 108.622 76.16 61.151 Insome before income taxes @) A cricut O Other income, niet 2,800 3,676 3.804 Income before income taxes 108,622 76,366 61.361 Income tax expense 20,630 25.402 19.422 Vet income $ 87.992 S 50,964 $ 41,939 Net income per share: Basic 3.18 $ 1.85 $ 151 Diluted 3.07 S 1.77 $ 1.48 Blumber of shares used in per share calculations: 27.692 27.611 27.698 Basic 28,640 28.753 28,292 Diluted Ym Brno 2019 http://investor robot.com/staticfiles/ale34092c23f-46646177-4b377860648 SIA A ALEKS -- Assess. Sherath - Home Amaron.com: Onli Code 3 merg & A Consolidated Balance Sheets Dec. 29, 2018 Dec. 30, 2017 Current assets: Cash and cash equivalents $ 130,373 $ 128,633 Short-term investments 31,605 37.225 Accounts receivable, net 162,166 142.829 Inventory 164,633 106,932 Other current assets 25,660 19,105 Total current assets $14.437 434,726 $7,026 44.579 Property and equipment, net Deferred tax assets 36,979 31 531 Goodwill 118.896 121.440 24 273 44,712 Intangible assets, net 15.350 14514 Other assets 766,961 691522 Total assets Current liabilities: TER cricut MLER Aises Sherpath - Home Amaron.com: Onli Code Emergene Aa Current liabilities: Accounts payable 136,742 116,316 Accrued expenses 71.259 73,647 Deferred revenue and customer advances 5.756 7,761 Total current liabilities 213,757 197724 Deferred tax liabilities 4.005 9,519 Other long-term liabilities 13,877 13.932 Total long-term liabilities 17882 21.471 Total liabilities 231.639 221.195 Commitments and contingencies: 0 0 278 279 Preferred stock, 5,000 shares authorized and none outstanding Common stock, 30.01 par value, 100,000 shares authorized: 27.788 and 27.945 shares issued and outstanding, respectively Additional paid in capital 172,771 190067 367,021 277.989 Retained earnings (4748 1.992 Accumulated other comprehensive (loss) income 70 aldarri n n
Step by Step Solution
There are 3 Steps involved in it

Get step-by-step solutions from verified subject matter experts