

Question: Please explain with proper explanation and calculation. Draw diagram if needed. Question 3: 10 marks The graph below shows the costs and revenue of a
Please explain with proper explanation and calculation. Draw diagram if needed.
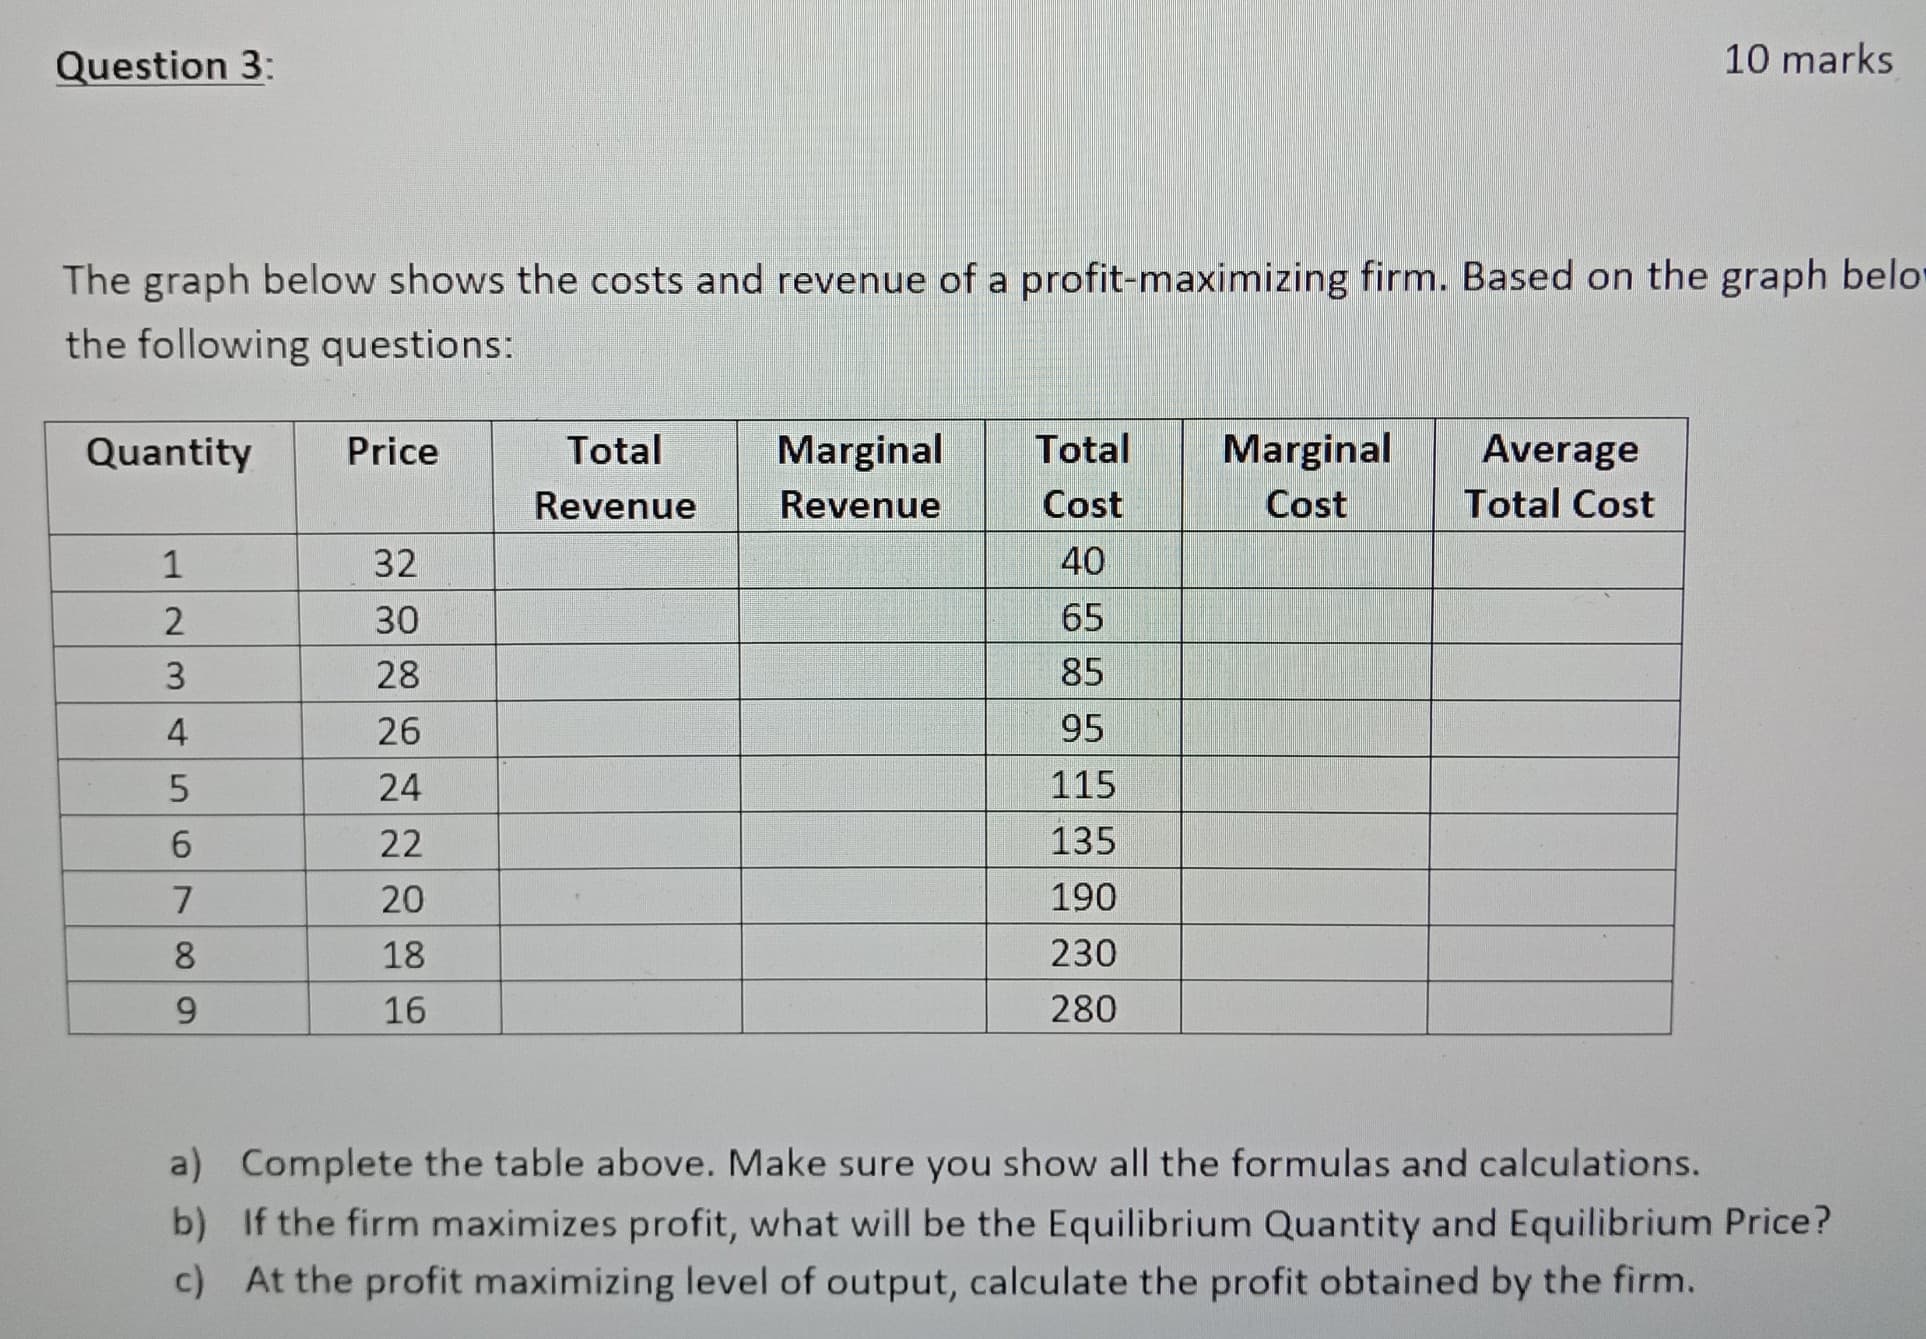
Question 3: 10 marks The graph below shows the costs and revenue of a profit-maximizing firm. Based on the graph belo the following questions: Quantity Price Total Marginal Total Marginal Average Revenue Revenue Cost Cost Total Cost 1 32 40 2 30 65 W 28 85 4 26 95 UT 24 115 6 22 135 20 190 8 18 230 16 280 a) Complete the table above. Make sure you show all the formulas and calculations. b) If the firm maximizes profit, what will be the Equilibrium Quantity and Equilibrium Price? c) At the profit maximizing level of output, calculate the profit obtained by the firm
Step by Step Solution
There are 3 Steps involved in it

Get step-by-step solutions from verified subject matter experts