

Question: please explain your answer 1 What is Walmart's Total Assets for the year of 2019? (in millions) Enter the answer in dollar format without $
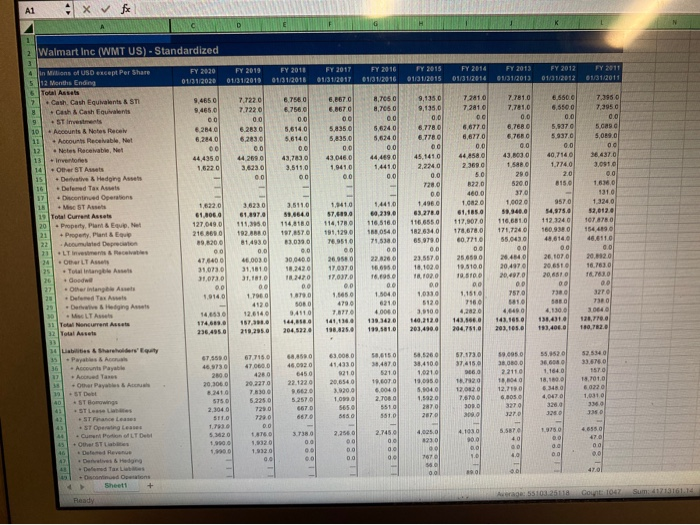
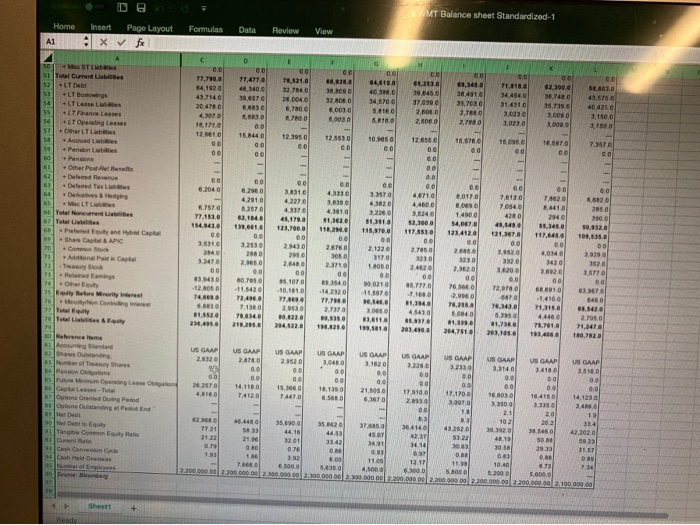
1 What is Walmart's Total Assets for the year of 2019? (in millions) Enter the answer in dollar format without $ sign or thousands comma -> 3519.23 and not $3,519.23 or 3,519.23 A1 x fx 2 Walmart Inc (WMT US) - Standardized FY 2020 01/31/2020 FY 2019 01/31/2011 FY 2011 01/01/2018 FY 2017 01/31/2017 FY 2016 01/31/2016 FY 2015 01/31/2015 FY 2014 01/31/2014 FY 2013 01/31/2013 FY 2012 01/31/2012 FY 2011 01/31/2011 9,4650 9.4650 00 82640 6,2840 7.7220 7.7220 0.0 6.2830 6,2830 0.0 44.2690 3,6230 00 6.756 0 6,7560 00 5,6140 5.6140 0.0 43,783.0 3,511.0 6,1670 6.8670 00 5,8350 5,8350 0.0 43,046.0 1.9410 00 87050 8,7050 0.0 6,6240 5,6240 0.0 44,469.0 1,441,0 0.0 6,660.0 6.5500 0.0 5,9370 5.937.0 0.0 40,7140 1.7740 2.0 815.0 44,435 0 1.6220 00 4 in Motions of USD except Per Share 512 Months Ending 5 Total Assets 2 - Cash Cash Equivalents & STI 8 + Cat Cash Equivalen 9 ST Investments 10 + Accounts & Notes Rece 11 Acous Receivable et 12 Notes Receivable et 13 - Invernes 14 Other ST Arts 15 + Derivative Hedging Ass 16 - Daleed Tax Assets 17 - Discontinued Operations 18 - MST A 19 Total Current Assets 20 Property, Pam & Evet 21 + Pretty, Pant & Eque 22 Aboumated Depot .LT in OLTA Totalitang dow 27 Othering A 20 Defend Text Dawie & Heiging Assets MLT Assets 31 Total Nourrer Acces 32 Total Assets 33 14 Liabilities & Shareholders' Equity 35 Pay A - Accounts Payable - Ada - Pay & A 19 + ST Dutt 40 +ST Bows 4 ST Lines 4 - ST France Leases +ST Operating Lease - Cum Porto LTD OST 1,6220 61.806 127,049.0 216 8600 89 200 00 47.6400 31.0730 31.0730 1:10 57.69.0 114,1780 191.129.0 76.9510 7.781.0 7.781,0 0.0 6,7680 6.7680 00 43.B3.0 1.5880 290 520.0 370 1,0020 58.900 116.681.0 171.7240 65.0430 0.0 20.4840 204970 20.4970 0.0 7570 3.6230 61.4970 111.395.0 192.RO 81.4930 0.0 46.003.0 31.1010 31.1810 00 1700 4120 12.614 187.3. 210.2010 3.511.0 58.6540 114.818.00 197,8570 13.030 0.0 30 000 18.2420 1870 0.0 11.0 5080 9:4110 164, 204.5220 9,1350 9,135.0 0.0 6.7780 6,7780 00 45, 1410 2,2240 0.0 7280 00 14960 63.278.0 116.6550 182.634.0 65 9700 0.0 23,657.0 18.1020 18.02.0 0.0 10330 5120 3,0100 140.2120 203,4900 72810 72810 00 86770 6,6770 0.0 44.858.0 2.369 0 50 6220 460.0 1 02 61.1850 117,9070 178,6780 80,7710 00 25.6500 19.510.0 19,5100 00 1.1510 7180 4,2820 143.5660 204.7810 14410 69,239.0 118 510.0 1880540 71.530.0 00 228260 16.095.0 18.00 00 1.5640 6210 4.0000 138 40 193.5810 7.3950 7.3950 0.0 sad 5,090 00 16.437.0 3.0910 0.0 1 6360 1310 1.3240 52,012.0 107.80 154.490 48.6110 0.0 200120 16.763.0 16.783.0 00 3270 7380 3.064 128,7700 180.RO 957.0 54,975.0 112.3240 160.9380 48,614.0 00 26.1070 20.651 20.6510 00 7380 SOBO 4.130,0 130.4310 193.4000 26.9580 17.037.0 17.037.0 20 1.6650 4790 7.8770 141.1360 198.82.0 1,9140 14,6530 174.683.0 236.495.0 46400 143.100 203.10 677150 470600 4280 29.2270 6850 46.0920 6450 22.1220 63.008.0 41.4330 9210 20,6540 3.200 CL 67.558.0 46.9730 2800 20,3060 8.2410 5750 2,304 5110 1.7930 5.2420 1.900.0 1.00 58.6150 30.4870 5210 1. BOTO 6.0040 2.7080 5510 5510 50.5260 38.4100 1.0210 18.0950 3.1040 1.5920 2870 2070 57.173.0 37,4150 360 1.720 12.0820 7.6700 300 30 59.950 31.000.0 22110 18,040 12,7190 6.0050 3270 27.0 55,9520 36.6080 1.1640 18.10 6.3480 4,0470 3200 52.5340 33.NO 1570 18.7010 60220 1.0310 3360 38 5.225.0 7200 7200 0.0 5.2570 6670 6670 5650 46550 4,0250 8230 3.7380 00 00 0.0 2.256.0 00 00 00 1.9320 1.5320 0.0 2.7450 00 00 00 4.1930 900 0.0 1.6 1.9750 0.0 0.0 40 00 40 02 00 100 7670 500 Danes & Hedging - De Taxi + Options Sheet + 00 1088 47.0 Sum Ready VMT Balance sheet Standardized-1 Home Formulas Data Review Insert Page Layout vft View A1 ES 5 19 11 00 D E G + M STL 0.0 2.0 00 0.0 00 OG 0.01 0,0 00 0.0 51 Total Current Liais 77,710.0 77,477.0 78.421.0 46,928.0 64,819.0 65,2010 43,345.0 71,6180 02.100.0 58,6030 52 +LT Debt 46,340 32.7840 38.co 39,645.0 38.4910 34 4540 38.7480 43,5750 +LT Bergs 43,7140 39.857e 240040 32.1080 34,570 0 37.239 35.7030 31.4310 38,7390 40425 - LT Lease Lite 20.478.0 6,683 6.700 6.000 5,8160 2.600 2,60 3,0230 30090 3,1500 55 +LT Finance Lease 700 6.003.0 8.8180 2,8080 2.788.0 3.0730 2.000.0 1500 56 +LT Operating Lesses 18,171.0 00 52 Other LT Lubes 12.061.0 15.8440 12.3950 12 5530 10.9050 12.655.0 18.576.0 150950 16.5970 7.3570 Accrued Liables 00 00 0.0 0.0 0.0 00 00 0.0 0.0 54 - Pension Labs 00 00 00 GO - Pensione 00 - Other Posted tents 0.0 -Detened Revenue 00 00 0.0 00 0.0 00 00 00 00 63 -Detened Tax Las 6.2040 6,2960 3.8310 4.333.0 3.3570 4,6710 8,0170 7,6130 7.1020 6,6120 50 4.2010 4.227.0 3,8390 43820 4.4000 0.0090 7,0540 8.4410 55 - Me LTL 2050 6.7570 5.2570 4.3370 4.3010 30 3,5240 1.490 4180 2140 310.0 66 Total Monument Labs 77.151.0 63.1040 45.1730 81.362.0 31.3519 $2,000 $4,047.0 49,5490 55.345.0 50.9320 67 Total La 154.141 13,601. 123,7000 1182100 115,00 117.8510 123.4120 121.370 117,645.0 108.535.0 65 Preferred and a 0.0 0.01 00 001 0.0 00 00 00 59 - Share Cat APIC 3,5310 3.2530 2.943.0 2.6760 2.1220 2.750 2.635.0 3.8520 4,0340 2000 70 + Commons 2640 2880 2050 305.0 3170 3230 3320 71 3230 3420 Ana din Capital 2,0650 3.2470 3520 2,6480 2.31 1.00 2.4020 2.3620 3.6.900 3.02.0 3,5770 00 00 00 0.01 0.01 00 00 73 00 00 00 83.8430 BOTAS 85. 1070 29,1540 90210 85.7770 765660 74 har 7,9780 68.691 12.8050 11.142 63.9670 101010 14,2320 -11.1970 -2.0960 75 qui efore Maritimes 5870 74.63 6460 72.4300 -1.410.0 77.00 17. 30,00 81,140 78 M 6830 70,2580 10.143.0 68.500 7.1380 2.9530 2.370 3.000 4.6430 5.6040 8.9950 4440 2,7050 81,6520 78.4340 19,220 2,8350 63,6110 8,370 01.30 234.4956 75.761.0 71,2470 218.285.0 204.122.0 11.7310 118,1250 199,5010 203.400 204,7810 79 203.1050 193,416.. 180.7820 Reference tema 81 Accounting Standard US GAAP US GAAP US GAAP US GAAP US GAAP US GAAP US GAAP US ORAP 2.8780 2.8320 US GAAP 3.0480 US GAAP 2.952.0 3.1020 3.320 32330 0.0 2.3140 3.4180 0.0 3.516.0 0.0 0.0 00 Pension 2.0 0:01 00 00 00 00 00 00 sumum Opeong Lased 0.0 20 0. 0.0 0.0 26.2570 14.1180 0.0 15,3660 18,1390 21.6050 Capitales Total 17.310.00 17.1700 4,8180 10.1030 10.4150 14,123.0 7412.0 7.4670 8,5680 6.367.0 2,033 87 Options and Duing Period 3,0970 3,3500 3.335 3.485.0 Ogions and End 00 1.8 2.1 2.0 19 Debt . 62.1680 33.4 46.4480 102 35.630 35.020 37.6450 304160 432920 39,3920 38.505.0 7721 42.2020 44.16 44.53 91 Tangible Con Ey Ratio 45.07 42.27 53.22 4. 21 22 22.01 5000 60231 21.90 33.42 341 3414 30.03 30.50 29.33 0.79 0.80 31.57 076 Thnh 06 0.93 09 1.93 0.01 0.00 0.88 0.8 3.52 Cash MedOveras 8.00 11.05 12.17 11.10 10.40 8.73 7 34 760D 6.500.0 54350 4,500 8.300.0 5.2000 2.200.000,00 200.00000 2300000-000000000 23000 220000000 220000000 220000000 200.000 2.1000000 5.000.0 + CH Sheet
Step by Step Solution
There are 3 Steps involved in it

Get step-by-step solutions from verified subject matter experts