

Question: Please fill in each open box worth 2 points 1-Fill in the percent and ratios to show the financial performance for Urban Outfitters for 2017
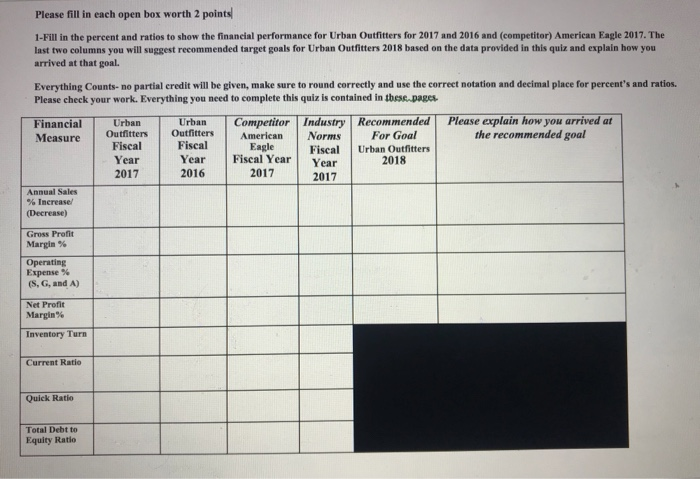
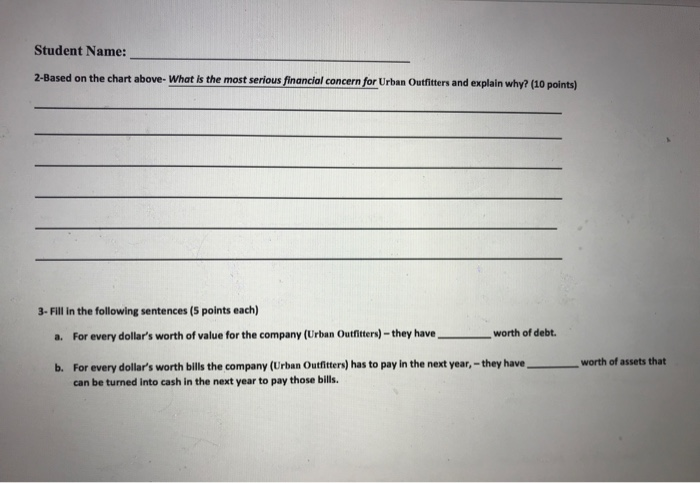
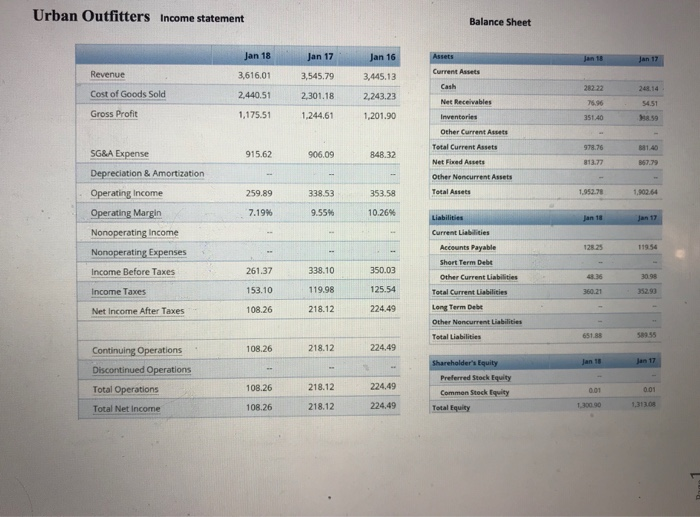
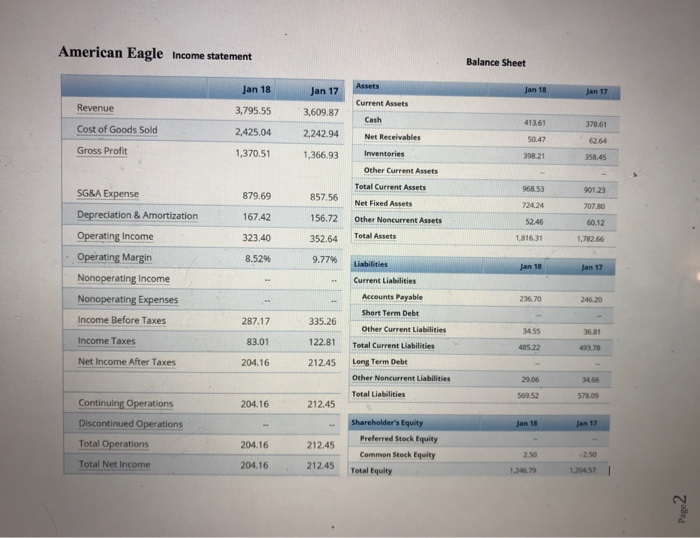
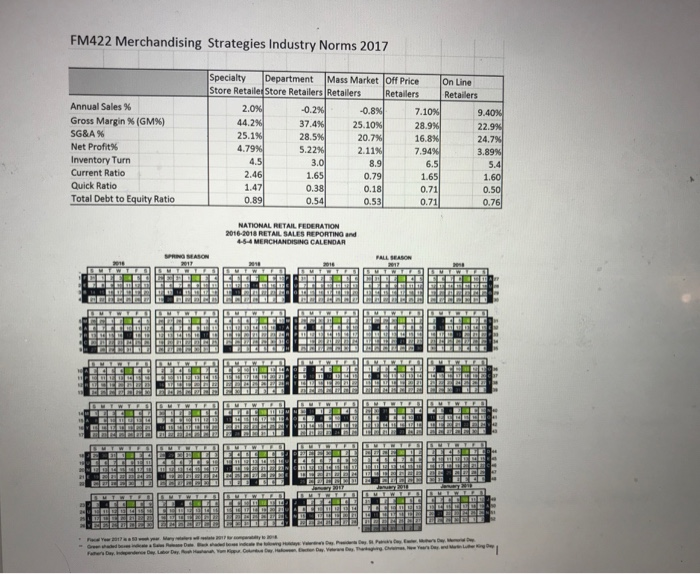
Please fill in each open box worth 2 points 1-Fill in the percent and ratios to show the financial performance for Urban Outfitters for 2017 and 2016 and (competitor) American Eagle 2017. The last two columns you will suggest recommended target goals for Urban Outfitters 2018 based on the data provided in this quiz and explain how you arrived at that goal. Everything Counts- no partial credit will be given, make sure to round correctly and use the correct notation and decimal place for percent's and ratios. Please check your work. Everything you need to complete this quiz is contained in tbess.pages Financial Urban Urban-T Competitor Industry Recommended Please explain how you arrived at Measure OutfittersOutfitters American Norms For Goal the recommended goal Fiscal Fiscal Year 2017 Eagle Year Fiscal Year Year 2017 Fiscal Urban Outfitters 2018 2016 2017 Annual Sales % Increase/ Decrease) Gross Profit Margin % Expense % (S, G, and A) Net Profit Margin % Inventory Turn Current Ratio Quick Ratio Total Debt to Equity Ratio Student Name: 2-Based on the chart above- What is the most serious financial concern for Urban Outfiters and explain why? (10 points) 3- Fill in the following sentences (5 points each) worth of debt. a. For every dollar's worth of value for the company (Urban Outfitters)-they have b. For every dollar's worth bills the company (Urban Outiters) has to pay in the next year,-they haveworth of assets that can be turned into cash in the next year to pay those bills. Urban Outfitters Income statement Balance Sheet Jan 18Jan 17Jan 16Assets 3,616.01 Current Assets Revenue Cost of Goods Sold Gross Profit 3,545.79 2.440.51 2,301.18 2,243.23 ,175.51 ,244.61 1,201.90 3,445.13 Cash 248.14 54.51 8 59 Net Receivables 351.40 Other Current Assets Total Current Assets 978.76 881.40 SG&A Expense Depreciation & Amortization Operating Income Operating Margin Nonoperating Income 915.62 906.09 848.32 813.77 Other Noncurrent Assets 259.89 338.53 353.58 Total Assets 7.19% 9.55% 10.26% Current Liabilities Accounts Payable 128.25 119.54 enses Short Term Deb Income Before Taxes Income Taxes Net Income After Taxes 261.37 153.10 108.26 338.10 119.98 218.12 350.03 125.54 224.49 Other Current Liabilities Total Current Liabilities Long Term Debe Other Noncurrent Liabilities Total Liabilities 352.93 651.88 58955 108.26 218.12 224,49 Continuing Operations Discontinued Operations Total Operations Total Net Income Preferred Stock Equity 108.26 218.12 224,49 0.01 Common Steck Equity 108.26 218.12 224.49 Total Equity American Eagle Income statement Balance Sheet Jan 18 Jan 17 Current Assets Revenue Cost of Goods Sold Gross Profit 3,795.55 3,609.87 ash 41361 50.47 398.21 7861 2 224294 Net Receivables 2,425.04 ,37051 136693 Inventories SG&A Expense Depreciation & Amortization Operating Income Operating Margin 879.69 67.42 323.40 8.52% 857.56 156.72 ther Noncurrent Assets 352.64 Total Assets 9.77% Other Current Assets Total Current Assets Net Fixed Assets 901.23 707.80 60.12 724.24 5246 1,81631 Jan 17 Current Liabilities Accounts Payable Short Term Debt Nonoperating Expenses Income Before Taxes Income Taxes Net Income After Taxes 236.70 287.17 83.01 204.16 335.26 Other Current Liabilities 122.31 Total Current Lisbilities 212.45 Long Term Debt 93.78 Other Noncurrent Liabilities 29.06 Total Liabilities 569.52 Continuing Operations Discontinued Operations Total Operations Total Net Income 204.16 212.45 Equity Preferred Stock Equity Common Stock Equity 204.16 212.45 250 2.50 204.16 16 21245 Tetal tquity 1,246.79 1,20457 FM422 Merchandising Strategies Industry Norms 2017 Price Store Retaile Store Retailers Retailers Ret 25.1 20. Gross 28. NATIONAL RETAIL FEDERATION Please fill in each open box worth 2 points 1-Fill in the percent and ratios to show the financial performance for Urban Outfitters for 2017 and 2016 and (competitor) American Eagle 2017. The last two columns you will suggest recommended target goals for Urban Outfitters 2018 based on the data provided in this quiz and explain how you arrived at that goal. Everything Counts- no partial credit will be given, make sure to round correctly and use the correct notation and decimal place for percent's and ratios. Please check your work. Everything you need to complete this quiz is contained in tbess.pages Financial Urban Urban-T Competitor Industry Recommended Please explain how you arrived at Measure OutfittersOutfitters American Norms For Goal the recommended goal Fiscal Fiscal Year 2017 Eagle Year Fiscal Year Year 2017 Fiscal Urban Outfitters 2018 2016 2017 Annual Sales % Increase/ Decrease) Gross Profit Margin % Expense % (S, G, and A) Net Profit Margin % Inventory Turn Current Ratio Quick Ratio Total Debt to Equity Ratio Student Name: 2-Based on the chart above- What is the most serious financial concern for Urban Outfiters and explain why? (10 points) 3- Fill in the following sentences (5 points each) worth of debt. a. For every dollar's worth of value for the company (Urban Outfitters)-they have b. For every dollar's worth bills the company (Urban Outiters) has to pay in the next year,-they haveworth of assets that can be turned into cash in the next year to pay those bills. Urban Outfitters Income statement Balance Sheet Jan 18Jan 17Jan 16Assets 3,616.01 Current Assets Revenue Cost of Goods Sold Gross Profit 3,545.79 2.440.51 2,301.18 2,243.23 ,175.51 ,244.61 1,201.90 3,445.13 Cash 248.14 54.51 8 59 Net Receivables 351.40 Other Current Assets Total Current Assets 978.76 881.40 SG&A Expense Depreciation & Amortization Operating Income Operating Margin Nonoperating Income 915.62 906.09 848.32 813.77 Other Noncurrent Assets 259.89 338.53 353.58 Total Assets 7.19% 9.55% 10.26% Current Liabilities Accounts Payable 128.25 119.54 enses Short Term Deb Income Before Taxes Income Taxes Net Income After Taxes 261.37 153.10 108.26 338.10 119.98 218.12 350.03 125.54 224.49 Other Current Liabilities Total Current Liabilities Long Term Debe Other Noncurrent Liabilities Total Liabilities 352.93 651.88 58955 108.26 218.12 224,49 Continuing Operations Discontinued Operations Total Operations Total Net Income Preferred Stock Equity 108.26 218.12 224,49 0.01 Common Steck Equity 108.26 218.12 224.49 Total Equity American Eagle Income statement Balance Sheet Jan 18 Jan 17 Current Assets Revenue Cost of Goods Sold Gross Profit 3,795.55 3,609.87 ash 41361 50.47 398.21 7861 2 224294 Net Receivables 2,425.04 ,37051 136693 Inventories SG&A Expense Depreciation & Amortization Operating Income Operating Margin 879.69 67.42 323.40 8.52% 857.56 156.72 ther Noncurrent Assets 352.64 Total Assets 9.77% Other Current Assets Total Current Assets Net Fixed Assets 901.23 707.80 60.12 724.24 5246 1,81631 Jan 17 Current Liabilities Accounts Payable Short Term Debt Nonoperating Expenses Income Before Taxes Income Taxes Net Income After Taxes 236.70 287.17 83.01 204.16 335.26 Other Current Liabilities 122.31 Total Current Lisbilities 212.45 Long Term Debt 93.78 Other Noncurrent Liabilities 29.06 Total Liabilities 569.52 Continuing Operations Discontinued Operations Total Operations Total Net Income 204.16 212.45 Equity Preferred Stock Equity Common Stock Equity 204.16 212.45 250 2.50 204.16 16 21245 Tetal tquity 1,246.79 1,20457 FM422 Merchandising Strategies Industry Norms 2017 Price Store Retaile Store Retailers Retailers Ret 25.1 20. Gross 28. NATIONAL RETAIL FEDERATION
Step by Step Solution
There are 3 Steps involved in it

Get step-by-step solutions from verified subject matter experts