

Question: Please fill in the missing MEAN information on these two excel tables. Food Group Food Item GWP Food Group (kgco,e 100kcal) 10pct! 90pct! median se
Please fill in the missing MEAN information on these two excel tables.
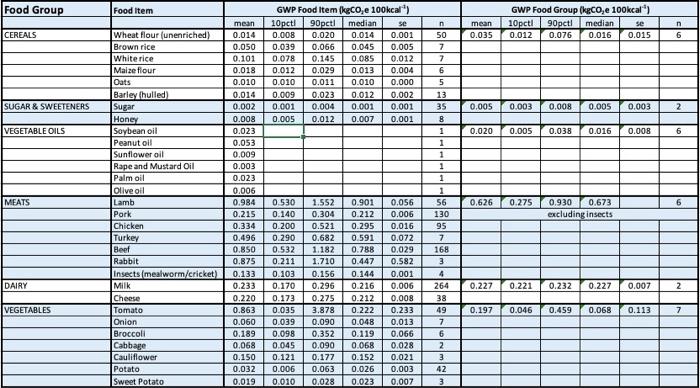
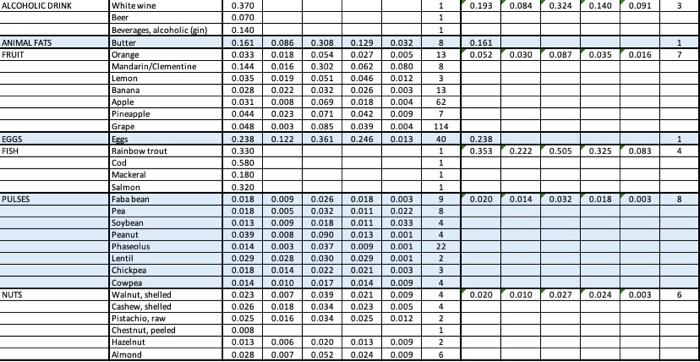
Food Group Food Item GWP Food Group (kgco,e 100kcal) 10pct! 90pct! median se 0.012 0.076 0.016 0.015 mean 0.035 n 6 CEREALS GWP Food Item(kgco, e 100kcal) 10pcti 90pct median se 0.008 0.020 0.014 0.001 0.039 0.066 0.045 0.005 0.078 0.145 0.085 0.012 0.012 0.029 0.013 0.004 0.010 0.011 0.010 0.000 0.009 0.023 0.012 0.002 0.001 0.004 0.001 0.001 0.005 0.012 0.007 0.001 SUGAR & SWEETENERS 0.005 0.003 0.008 0.005 0.003 2 VEGETABLE OILS 0.020 0.005 0.038 0.016 0.008 6 MEATS mean 0.014 0.050 0.101 0.018 0.010 0.014 0.002 0.008 0.023 0.053 0.009 0.003 0.023 0.006 0.984 0.215 0.334 0.496 0.850 0.875 0.133 0.233 0.220 0.863 0.060 0.189 0.068 0.150 0.032 0.019 Wheat flour (unenriched) Brown rice White rice Maize fiour Oats Barley hulled) Sugar Honey Soybean oil Peanut oil Sunflower oil Rape and Mustard Oil Palm oil Olive oil Lamb Pork Chicken Turkey Beef Rabbit Insects (meatworm/cricket Milk Cheese Tomato Onion Broccoli Cabbage Cauliflower Potato Sweet Potato 0,626 0.275 0.930 0.673 excluding insects n 50 7 7 6 5 13 35 8 1 1 1 1 1 1 56 130 95 7 168 3 4 264 38 49 7 6 2. 3 42 3 DAIRY 0.227 0.221 0.232 0.227 0.007 0.530 0.140 0.200 0.290 0.532 0.211 0.103 0.170 0.173 0.035 0.039 0.098 0.045 0.121 0.006 0.010 2 1.552 0.304 0.521 0.682 1.182 1.710 0.156 0.296 0.275 3.878 0.090 0.352 0.090 0.177 0.063 0.028 0.901 0.212 0.295 0.591 0.788 0.447 0.144 0.216 0.212 0.222 0.048 0.119 0.068 0.152 0.026 0.023 0.056 0.006 0.016 0.072 0.029 0.582 0.001 0.006 0.008 0.233 0.013 0.066 0.028 0.021 0.003 0.007 VEGETABLES 0.197 0.046 0.459 0.068 0.113 7 D ALCOHOLIC DRINK 0.193 0.084 0.324 0.140 0.091 3 1 1 1 ANIMAL FATS FRUIT 0.161 0.052 1 7 0.030 0.087 0.035 0.016 0.086 0.018 0.016 0.019 0.022 0.008 0.023 0.003 0.122 0.308 0.054 0.302 0.051 0.032 0.069 0.071 0.085 0.361 0.129 0.027 0.062 0.046 0.026 0.018 0.042 0.039 0.246 0.032 0.005 0.080 0.012 0.003 0.004 0.009 0.004 0.013 EGGS FISH 0.238 0.353 1 4 0.222 0.505 0.325 0.083 White wine Beer Beverages, alcoholic sin Butter Orange Mandarin/Clementine Lemon Banana Apple Pineapple Grape Eges Rainbow trout Cod Mackeral Salmon Faba bean Pea Soybean Peanut Phaseolus Lentil Chickpea Cowpea Walnut, shelled Cashew, shelled Pistachio, raw Chestnut, peeled Hazelnut Almond 0.370 0.070 0.140 0.161 0.033 0.144 0.035 0.028 0.031 0.044 0.048 0.238 0.330 0.580 0.180 0.320 0.018 0.018 0.013 0.039 0.014 0.029 0.018 0.014 0.023 0.026 0.025 0.008 0.013 0.028 PULSES 0.020 0.014 0.032 8 13 8 3 13 62 7 114 40 1 1 1 1 9 8 4 4 22 2. 3 4 4 4 2 1 2 6 0.018 0.003 0.009 0.005 0.009 0.008 0.003 0.028 0.014 0.010 0.007 0.018 0.016 8 0.026 0.032 0.018 0.090 0.037 0.030 0.022 0.017 0.039 0.034 0.034 0.018 0.011 0.011 0.013 0.009 0.029 0.021 0.014 0.021 0.023 0.025 0.003 0.022 0.033 0.001 0.001 0.001 0.003 0.009 0.009 0.005 0.012 NUTS 0.020 0.010 0.027 0.024 0.003 6 0.006 0.007 0.020 0.052 0.013 0.024 0.009 0.009
Step by Step Solution
There are 3 Steps involved in it

Get step-by-step solutions from verified subject matter experts