

Question: Please fill out the Table with the information provided on the first 2 excel sheets Assumptions Annual Output (metric tons) Output Cain/Original Output Price/ton (pounds
Please fill out the Table with the information provided on the first 2 excel sheets
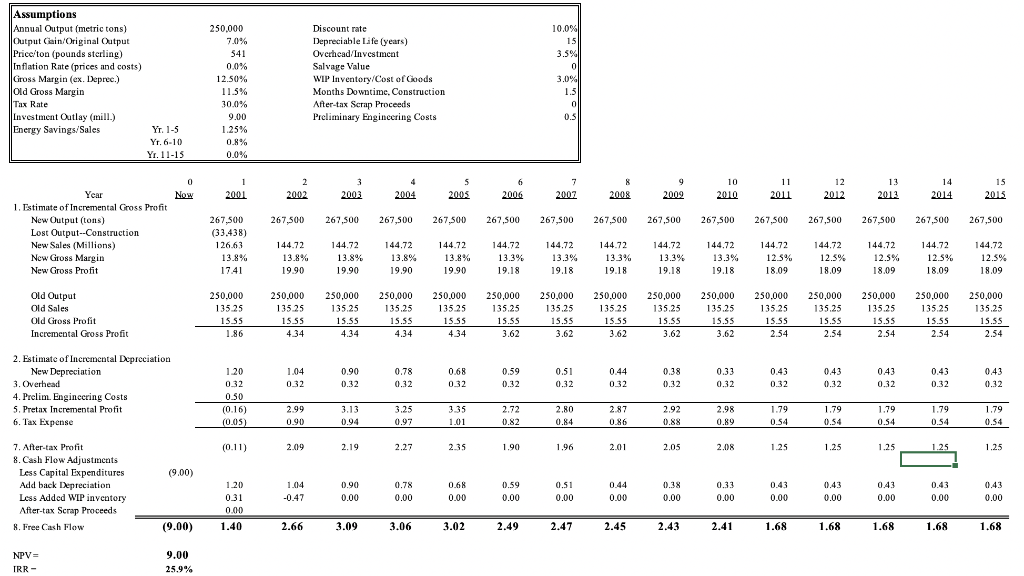
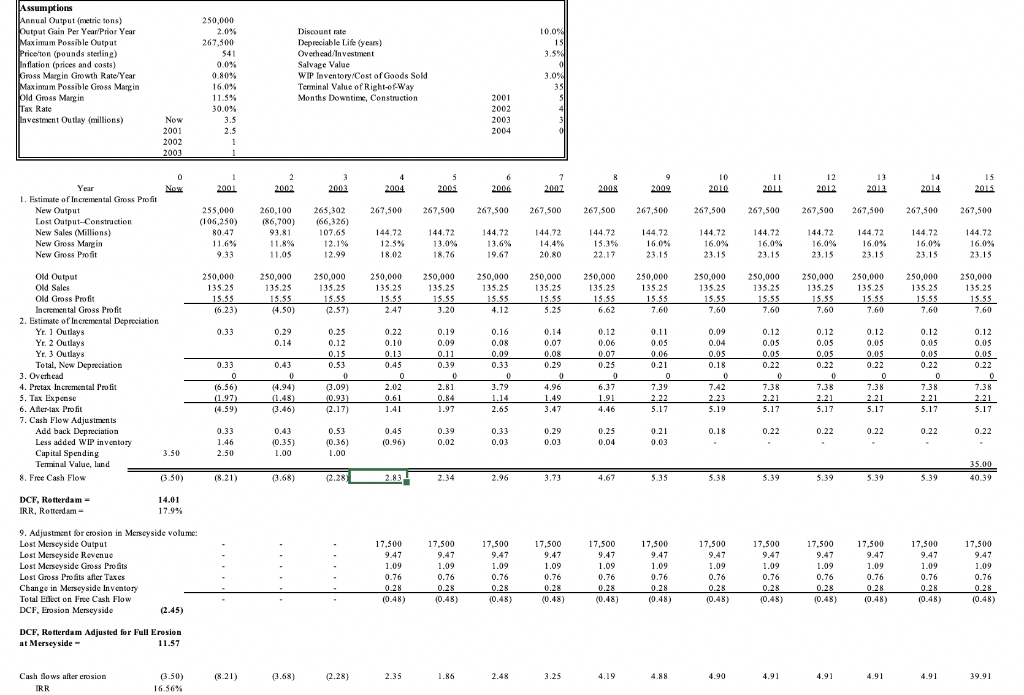
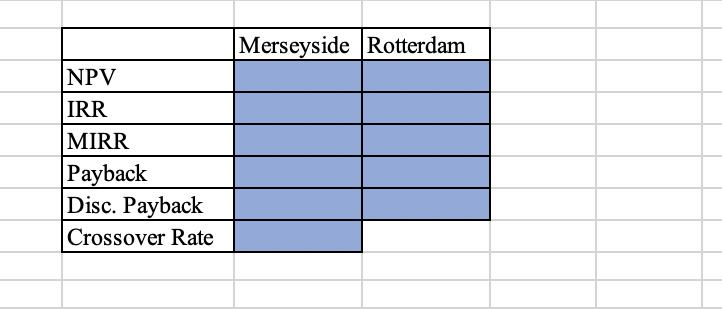
Assumptions Annual Output (metric tons) Output Cain/Original Output Price/ton (pounds sterling) Inflation Rate (prices and costs) Gross Margin (ex. Deprec.) Old Gross Margin Tax Rate Investment Outlay (mill.) Energy Savings/Sales 250.000 7.0% 541 0.0% 12.50% 11.5% 30.0% 9.00 1.25% 0.8% 0.0% Discount rate Depreciable Lafe (years) Ovcrhcad Investment Salvage Value WIP Inventory/Cost of Goods Months Downtime. Construction After-tax Scrap Proceeds Preliminary Engineering Costs 10.0% 15 3.5% 0 3.0% 1.5 0 0.5 Yr. 1-5 Yr. 6-10 Yr. 11-15 4 0 Now 1 2001 2 2002 3 2003 5 2005 6 2006 7 2002 8 2008 9 2009 10 2010 11 2011 12 2012 13 2012 14 2014 15 2015 2004 267,500 267,500 267 SOO 267,500 267,500 267,500 267.500 267,500 267,500 267,500 267,500 267,500 267,500 267,500 Year 1. Estimate of Incremental Gross Profit New Output (tons) Lost Output--Construction New Sales (Millions) New Gross Margin New Gross Profit 267,500 (33.438) 126.63 13.8% 17.41 144.72 13.8% 19.90 144.72 13.8% 19.90 144.72 13.8% 19.90 144.72 13.8% 19.90 144.72 13.3% 19.18 144.72 13.3% 19.18 144.72 13.3% 19.18 144.72 13.3% 19.18 144.72 13.3% 19.18 144.72 12.5% 18.09 144.72 12.5% 18.09 144.72 12.5% 18.09 144.72 12.5% 18.09 144.72 12.5% 18.09 Old Output Old Sales Old Gross Profit Incremental Gross Profit 250.000 135.25 15.55 1.86 250.000 135.25 15.55 4.34 250,000 135.25 15.55 4.34 250.000 135.25 1S.SS 4.34 250.000 135.25 1555 434 250,000 135.25 15.55 3.62 250,000 135.25 15.55 3.62 250.000 135.25 15.SS 3.62 250,000 135.25 1S.SS 3.62 250,000 135.25 15.SS 3,62 250.000 135.25 15.55 2.54 250,000 135.25 15.55 2.54 250.000 135.25 15.SS 2.54 250,000 135.25 15.55 2.54 250,000 135.25 15.55 2.54 1.04 032 0.90 0.32 0.78 0.32 0.68 032 0.59 0.32 0.51 0.32 0.44 032 0.38 0.32 0.33 0.32 0.43 0.32 0.43 0.32 0.43 0.32 0.43 0.32 0.43 0.32 2. Estimate of Incremental Depreciation New Depreciation 3. Overhead 4. Prelim. Engineering Costs 5. Pretax Incremental Profit 6. Tax Expense 1.20 032 0.50 (0.16) (0.05) 2.99 0.90 3.13 0.94 3.25 0.97 3.35 1.01 2.72 0.82 2.80 0.84 2.87 0.86 2.92 0.88 2.98 0.89 1.79 0.54 1.79 0.54 1.79 0.54 1.79 0.54 1.79 0.54 (0.11) 2.09 2.19 2.27 2.35 1.90 1.96 2.01 2.05 2.08 1.25 1.25 1.25 1.25 1.25 (9.00) () 7. After-tax Profit 8. Cash Flow Adjustments Less Capital Expenditures Add back Depreciation Less Added WIP inventory After-tax Scrap Proceeds 8. Free Cash Flow 0.90 1.20 031 0.00 1.04 -0.47 0.78 0.00 0.68 0.00 0.59 0.00 0.51 0.00 0.44 0.00 0.38 0.00 0.33 0.00 0.43 0.00 0.43 0.00 0.43 0.00 0.43 0.00 0.00 0.00 (9.00) 1.40 2.66 3.09 3.06 3.02 2.49 2.47 2.45 2.43 2.41 1.68 1.68 1.68 1.68 1.68 NPV= IRR- 9.00 25.9% Assumptions Annual Output Year Maximum Possible Output 250,000 Discount rate Depreciable Lite (years Overhead Investment 0.80% we cntory Cost of Goods Sold Terminal Value of Right-of-Way Months Downtime, Construction 2002 2004 2012 267,500 (106503 80.47 . 93.81 107.65 144.72 18.03 ad 18.76 18. 250,000 1648 (6.23) 450.000 15.55 14.50 30,00 1er (2.57) 186 155 2.41 15.55 15.5 1865 2 13.55 1559 3.20 OM Grosso Incremental Gross Profit Depreciation Yr 1 outleys Yr. 2 Outlays 0.33 0:22 0.14 . Oo oo .IS 2 (4.94 46 3. Overhead 4. Pretax incremento 6. Aller-tax Profit Cash Flow Adjustments Less added IP inventory Capital Spending Free Cash Flow 0.45 (0.96 0.39 0.22 0.25 (0.35 0.03 3.50 sox 1821) (3.68) 2.28 2.83 2.34 3.7 .67 5.39 DCF, Rotterdam 14.01 Adjustment for crosion in Merseyside volume Lost Merseyside Revenue 9.4 9.41 est Merseyside Gross Pro 1.09 Change in Merseyside Inventor al Effect on Free Cash Flow (2.45 DCF, Rotterdam Adjusted for Full Erosion 1.25 Cash flows after emosion 1.90 4.91 Merseyside Rotterdam NPV IRR MIRR Payback Disc. Payback Crossover Rate Assumptions Annual Output (metric tons) Output Cain/Original Output Price/ton (pounds sterling) Inflation Rate (prices and costs) Gross Margin (ex. Deprec.) Old Gross Margin Tax Rate Investment Outlay (mill.) Energy Savings/Sales 250.000 7.0% 541 0.0% 12.50% 11.5% 30.0% 9.00 1.25% 0.8% 0.0% Discount rate Depreciable Lafe (years) Ovcrhcad Investment Salvage Value WIP Inventory/Cost of Goods Months Downtime. Construction After-tax Scrap Proceeds Preliminary Engineering Costs 10.0% 15 3.5% 0 3.0% 1.5 0 0.5 Yr. 1-5 Yr. 6-10 Yr. 11-15 4 0 Now 1 2001 2 2002 3 2003 5 2005 6 2006 7 2002 8 2008 9 2009 10 2010 11 2011 12 2012 13 2012 14 2014 15 2015 2004 267,500 267,500 267 SOO 267,500 267,500 267,500 267.500 267,500 267,500 267,500 267,500 267,500 267,500 267,500 Year 1. Estimate of Incremental Gross Profit New Output (tons) Lost Output--Construction New Sales (Millions) New Gross Margin New Gross Profit 267,500 (33.438) 126.63 13.8% 17.41 144.72 13.8% 19.90 144.72 13.8% 19.90 144.72 13.8% 19.90 144.72 13.8% 19.90 144.72 13.3% 19.18 144.72 13.3% 19.18 144.72 13.3% 19.18 144.72 13.3% 19.18 144.72 13.3% 19.18 144.72 12.5% 18.09 144.72 12.5% 18.09 144.72 12.5% 18.09 144.72 12.5% 18.09 144.72 12.5% 18.09 Old Output Old Sales Old Gross Profit Incremental Gross Profit 250.000 135.25 15.55 1.86 250.000 135.25 15.55 4.34 250,000 135.25 15.55 4.34 250.000 135.25 1S.SS 4.34 250.000 135.25 1555 434 250,000 135.25 15.55 3.62 250,000 135.25 15.55 3.62 250.000 135.25 15.SS 3.62 250,000 135.25 1S.SS 3.62 250,000 135.25 15.SS 3,62 250.000 135.25 15.55 2.54 250,000 135.25 15.55 2.54 250.000 135.25 15.SS 2.54 250,000 135.25 15.55 2.54 250,000 135.25 15.55 2.54 1.04 032 0.90 0.32 0.78 0.32 0.68 032 0.59 0.32 0.51 0.32 0.44 032 0.38 0.32 0.33 0.32 0.43 0.32 0.43 0.32 0.43 0.32 0.43 0.32 0.43 0.32 2. Estimate of Incremental Depreciation New Depreciation 3. Overhead 4. Prelim. Engineering Costs 5. Pretax Incremental Profit 6. Tax Expense 1.20 032 0.50 (0.16) (0.05) 2.99 0.90 3.13 0.94 3.25 0.97 3.35 1.01 2.72 0.82 2.80 0.84 2.87 0.86 2.92 0.88 2.98 0.89 1.79 0.54 1.79 0.54 1.79 0.54 1.79 0.54 1.79 0.54 (0.11) 2.09 2.19 2.27 2.35 1.90 1.96 2.01 2.05 2.08 1.25 1.25 1.25 1.25 1.25 (9.00) () 7. After-tax Profit 8. Cash Flow Adjustments Less Capital Expenditures Add back Depreciation Less Added WIP inventory After-tax Scrap Proceeds 8. Free Cash Flow 0.90 1.20 031 0.00 1.04 -0.47 0.78 0.00 0.68 0.00 0.59 0.00 0.51 0.00 0.44 0.00 0.38 0.00 0.33 0.00 0.43 0.00 0.43 0.00 0.43 0.00 0.43 0.00 0.00 0.00 (9.00) 1.40 2.66 3.09 3.06 3.02 2.49 2.47 2.45 2.43 2.41 1.68 1.68 1.68 1.68 1.68 NPV= IRR- 9.00 25.9% Assumptions Annual Output Year Maximum Possible Output 250,000 Discount rate Depreciable Lite (years Overhead Investment 0.80% we cntory Cost of Goods Sold Terminal Value of Right-of-Way Months Downtime, Construction 2002 2004 2012 267,500 (106503 80.47 . 93.81 107.65 144.72 18.03 ad 18.76 18. 250,000 1648 (6.23) 450.000 15.55 14.50 30,00 1er (2.57) 186 155 2.41 15.55 15.5 1865 2 13.55 1559 3.20 OM Grosso Incremental Gross Profit Depreciation Yr 1 outleys Yr. 2 Outlays 0.33 0:22 0.14 . Oo oo .IS 2 (4.94 46 3. Overhead 4. Pretax incremento 6. Aller-tax Profit Cash Flow Adjustments Less added IP inventory Capital Spending Free Cash Flow 0.45 (0.96 0.39 0.22 0.25 (0.35 0.03 3.50 sox 1821) (3.68) 2.28 2.83 2.34 3.7 .67 5.39 DCF, Rotterdam 14.01 Adjustment for crosion in Merseyside volume Lost Merseyside Revenue 9.4 9.41 est Merseyside Gross Pro 1.09 Change in Merseyside Inventor al Effect on Free Cash Flow (2.45 DCF, Rotterdam Adjusted for Full Erosion 1.25 Cash flows after emosion 1.90 4.91 Merseyside Rotterdam NPV IRR MIRR Payback Disc. Payback Crossover Rate
Step by Step Solution
There are 3 Steps involved in it

Get step-by-step solutions from verified subject matter experts