

Question: Please fill the space using 2019 data Please keep the answer in two decimal places. material Financial statements of a EU firm EU.pdf - 2022-04-14
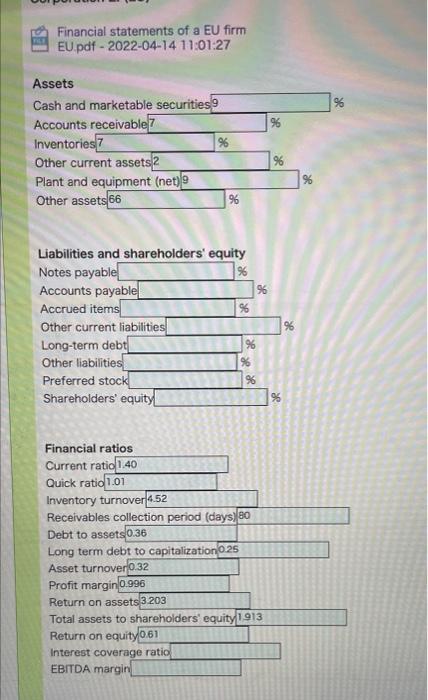
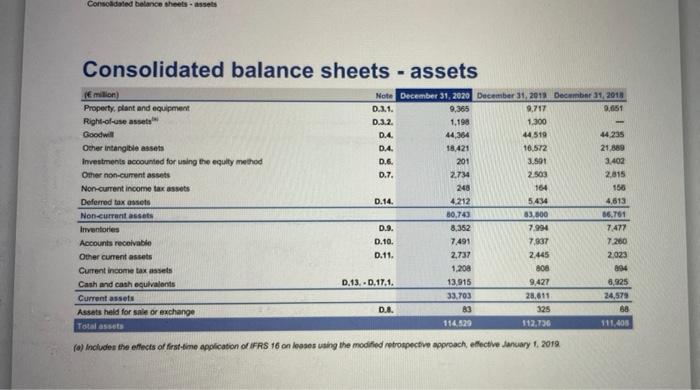
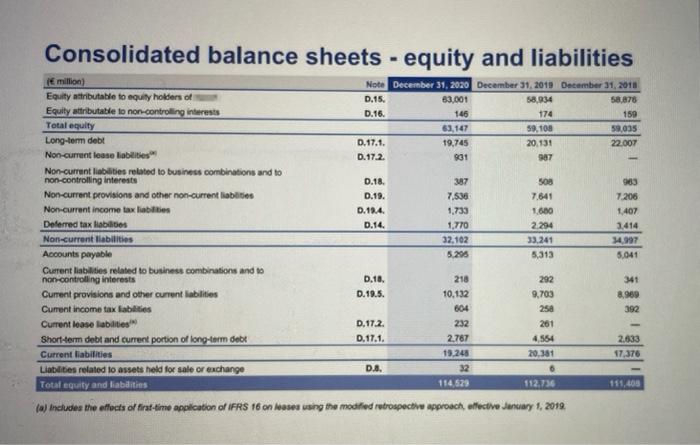
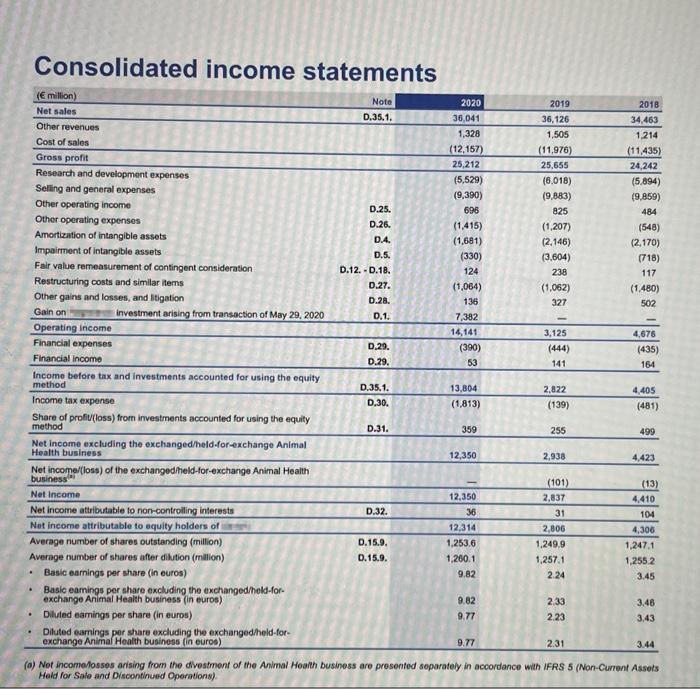
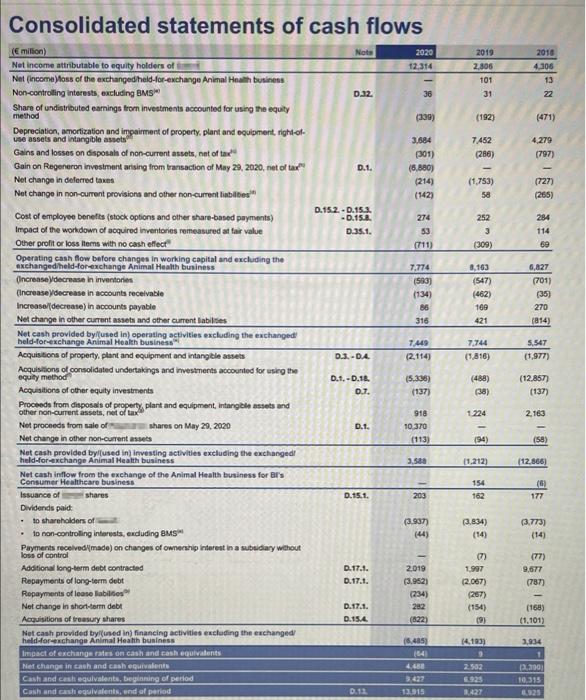
Financial statements of a EU firm EU.pdf - 2022-04-14 11:01:27 % 96 Assets Cash and marketable securities 9 Accounts receivable7 Inventories % Other current assets 2 Plant and equipment (net) 9 Other assets 66 96 % % Liabilities and shareholders' equity Notes payable 96 Accounts payable 96 Accrued items! % Other current liabilities % Long-term debt| % Other liabilities % Preferred stock 96 Shareholders' equity! % Financial ratios Current ratio 1.40 Quick ratio 1.01 Inventory turnover 4.52 Receivables collection period (days) 80 Debt to assets 0.36 Long term debt to capitalization 0.25 Asset turnover 0.32 Profit margin 0.996 Return on assets 3.203 Total assets to shareholders' equity 1913 Return on equity 0.61 Interest coverage ratio EBITDA margin Conscadoled balance sheets-assets Consolidated balance sheets - assets milion Property, plant and equipment Right-of-use asset Goodwill Other intangible assets Investments accounted for using the equity method Other non-current assets Non-current income tax assets Deferred tax assets Non-current assets Inventories Accounts receivable Other current assets Current income tax assets Cash and cash equivalents Current assets Assets held for sale or exchange Total assets Note December 31, 2020 December 31, 2013 December 31, 2018 D.2.1. 9,365 9.717 9.051 D.3.2. 1.198 1.300 04 44,364 44.519 44.235 D4 18,421 16.572 21 889 0.6. 201 3.501 3.402 0.7. 2.734 2.503 2.815 248 164 156 D.14. 4212 5434 4,613 80,74 83.800 86,761 D.9. 8,352 7.994 7477 0.10 7.491 7907 7260 0.11. 2.737 2.445 2023 1.208 800 194 D.13.0.17.1. 13,915 9.427 6,825 33,703 28.611 24,578 D.A. 83 325 68 114.529 112.736 (a) Includes the effects of first-time application of IFRS 16 on ses using the modified retrospective approach, effective January 1, 2019 Consolidated balance sheets - equity and liabilities 1 ( million Note December 31, 2020 December 31, 2019 December 31, 2018 Equity attributable to equily holders of D.15. 83.001 58,934 58,878 Equity attributable to non-controlling interests D.16. 146 174 159 Total equity 63,147 59,108 59,035 Long-term debt D.17.1. 19,745 20.131 22.007 Non-current lease liabilities D.17.2 931 987 Non-current liabilities related to business combinations and to non-controlling interests D.18. 387 508 903 Non-current provisions and other non-current liabilities 0.19. 7,536 7.641 7.206 Non-current income tax liabilities 0.18.4. 1.733 1.650 1 407 Deferred tax liabilities D.14. 1.770 2.294 3.414 Non-current liabilities 32.102 33,241 14.997 Accounts payable 5.295 5.313 5.041 Current liabilities related to business combinations and to non-controlling interests D.18. 218 292 341 Current provisions and other current liabilities D. 19.5. 10.132 9,703 8.960 Current income tax labilities 604 258 392 Current loase abilities D.17.2. 232 261 Short-term debt and current portion of long-term debe D. 17.1. 2.767 4564 2.633 Current liabilities 19,248 20,381 17,376 Liabilities related to assets hold for sale or exchange D.A. 32 . Total equity and liabilities 114.529 112.736 (a) Includes the effects of first-time application of IFRS 16 on leases using the modified retrospective approach, effective January 1, 2019. Consolidated income statements 484 0.29. ( million) Note 2020 2019 2018 Net sales D.35.1. 36,041 36,126 34,463 Other revenues 1,328 1,505 1.214 Cost of sales (12,157) (11,976) (11,435) Gross profit 25,212 25,655 24,242 Research and development expenses (5,529) (6.018) (5.894) Selling and general expenses (9,390) (9,883) (9,859) Other operating Income D.25. 696 825 Other operating expenses D.26. (1,415) (1,207) (548) Amortization of intangible assets D.4. (1.681) (2.146) (2,170) Impairment of intangible assets D.5. (330) (3.604) (718) Fair value remeasurement of contingent consideration D.12.-D.18. 124 238 117 Restructuring costs and similar items 0.27. (1,064) (1,062) (1.480) Other gains and losses, and itigation 0.28. 136 327 502 Gain on investment arising from transaction of May 29, 2020 0.1. 7,382 Operating income 14,141 3,125 4,676 Financial expenses D.29. (390) (444) (435) Financial Income 53 141 164 Income before tax and investments accounted for using the equity method D.35.1. 13,804 2.822 4,405 Income tax expense D.30. (1.813) (139) (481) Share of profu(loss) from Investments accounted for using the equity method D.31. 359 255 499 Net Income excluding the exchanged/held for exchange Animal Health business 12,350 2,938 4,423 Net income/loss) of the exchangedheld-for-exchange Animal Health business (101) Net Income 12,350 2,837 4.410 Net Income attributable to non-controlling Interests D.32. 36 31 104 Net income attributable to equity holders of 12,314 2,806 4,300 Average number of shares outstanding (million) D.15.9. 1.253.6 1.249.9 1,247.1 Average number of shares after dilution (million) 0.15.9. 1.260.1 1,257.1 1,255.2 Basic earnings per share (in euros) 9.82 2.24 3.45 Basic earrings per share excluding the exchanged/hold-for- exchange Animal Health business (in euros) 9.82 233 3,46 Diluted earings per share (in euros) 9.77 2.23 3.43 Diluted eamings por share excluding the exchangedheld-for- exchange Animal Health business in euros) 9.77 2.31 3.44 (a) Not income fosses arising from the divestment of the Animal Health business are presented soparately in accordance with IFRS 5 (Non-Current Assets Hold for Sale and Discontinued Operations) (13) Consolidated statements of cash flows Note 2020 12.314 2019 2.806 101 31 2010 4,305 13 22 0.32 36 (339) (192) (471) 7452 (288) 4.279 (797) D.1. 3.684 (301) (6,880) (214) (542) (1.753) 58 (727) (265) 252 D.15 2.-D.15.3. -D.15.8. D.35.1. 284 274 30 (711) 3 (309) 69 7.774 (583) (134) 56 316 8.163 (547) (462) 109 421 6.827 (701) (35) 270 (814) 5.547 7.49 (2.114) 7,744 (9.816) 0.3.-04 (1.977) E million) Net income attributable to equity holders of Net (incomalous of the exchanged haid-for-exchange Animal Health business Non-controlling interests, excluding BMS Share of undistributed earnings from investments accounted for using the equity method Depreciation, amortization and impairment of property, plant and equipment, right-of- use assets and intangible assets Gains and losses on disposal of non-current assets, net of tax Gain on Regeneron Investment arising from transaction of May 29, 2020, net of tax" Net change in deferred taxes Not change in non-current provisions and other non-current liabilities Cost of employee benefits (stock options and other share-based payments) Impact of the workdown of acquired inventories remeasured at fair value Other profit or loss items with no cash effect Operating cash flow before changes in working capital and excluding the exchanged held for exchange Animal Health business Increase y decrease in inventories Encrease y decrease in accounts receivable Increase/(decrease) in accounts payable Net change in other current assets and other current abilities Net cash provided by used in) operating activities excluding the exchanged held-for-exchange Animal Health business Acquisitions of property, plant and equipment and intangible assets Acquisitions of consolidated undertakings and investments accounted for using the equity method Acquisitions of other equity investments Proceeds from disposals of property, plant and equipment, Intangible assets and other non-current assets, net of tax Net proceeds from sale of shares on May 20, 2020 Net change in other non-current assets Net cash provided by used in investing activities excluding the exchanged held for exchange Animal Health business Net cash inflow from the exchange of the Animal Health business for Br's Consumer Healthcare business Issuance of shares Dividends paid to shareholders of to non-controlling interests, excluding BMS Payments receivedlmado) on changes of ownership interest in a subsidiary without loss of control Additional long-term debt contracted Repayments of long-term debit Repayments of lease labilis Not change in short-term debt Acquisitions of treasury shares Net cash provided by used in financing activities excluding the exchanged held-or-change Animal Health business Impact of exchange rates on cash and cash equivalents Nel change in cash and cash equivalent Cash and cash equivalents, beginning of period Cash and cash equivalents, and a period D.1.-1.18 0.7. (5.338) (137) (488) (38) (12.857) (137) 918 1224 2.163 Dt. 10.370 (113) (94) (58) 3.580 (1.212) (12.866) 154 (6) 177 D.15.1. 203 (3.937 2.834) (3.773) (14) D.17.1. D.17.1. 9,677 (787) 2019 (3.952) (234) 282 (122) 1997 (2.067) (267) (154) D.17.1. 0.154 (168) (1.101) 16.405 14.193) 3,934 2.502 3.422 12915 200 10,315 1925 Financial statements of a EU firm EU.pdf - 2022-04-14 11:01:27 % 96 Assets Cash and marketable securities 9 Accounts receivable7 Inventories % Other current assets 2 Plant and equipment (net) 9 Other assets 66 96 % % Liabilities and shareholders' equity Notes payable 96 Accounts payable 96 Accrued items! % Other current liabilities % Long-term debt| % Other liabilities % Preferred stock 96 Shareholders' equity! % Financial ratios Current ratio 1.40 Quick ratio 1.01 Inventory turnover 4.52 Receivables collection period (days) 80 Debt to assets 0.36 Long term debt to capitalization 0.25 Asset turnover 0.32 Profit margin 0.996 Return on assets 3.203 Total assets to shareholders' equity 1913 Return on equity 0.61 Interest coverage ratio EBITDA margin Conscadoled balance sheets-assets Consolidated balance sheets - assets milion Property, plant and equipment Right-of-use asset Goodwill Other intangible assets Investments accounted for using the equity method Other non-current assets Non-current income tax assets Deferred tax assets Non-current assets Inventories Accounts receivable Other current assets Current income tax assets Cash and cash equivalents Current assets Assets held for sale or exchange Total assets Note December 31, 2020 December 31, 2013 December 31, 2018 D.2.1. 9,365 9.717 9.051 D.3.2. 1.198 1.300 04 44,364 44.519 44.235 D4 18,421 16.572 21 889 0.6. 201 3.501 3.402 0.7. 2.734 2.503 2.815 248 164 156 D.14. 4212 5434 4,613 80,74 83.800 86,761 D.9. 8,352 7.994 7477 0.10 7.491 7907 7260 0.11. 2.737 2.445 2023 1.208 800 194 D.13.0.17.1. 13,915 9.427 6,825 33,703 28.611 24,578 D.A. 83 325 68 114.529 112.736 (a) Includes the effects of first-time application of IFRS 16 on ses using the modified retrospective approach, effective January 1, 2019 Consolidated balance sheets - equity and liabilities 1 ( million Note December 31, 2020 December 31, 2019 December 31, 2018 Equity attributable to equily holders of D.15. 83.001 58,934 58,878 Equity attributable to non-controlling interests D.16. 146 174 159 Total equity 63,147 59,108 59,035 Long-term debt D.17.1. 19,745 20.131 22.007 Non-current lease liabilities D.17.2 931 987 Non-current liabilities related to business combinations and to non-controlling interests D.18. 387 508 903 Non-current provisions and other non-current liabilities 0.19. 7,536 7.641 7.206 Non-current income tax liabilities 0.18.4. 1.733 1.650 1 407 Deferred tax liabilities D.14. 1.770 2.294 3.414 Non-current liabilities 32.102 33,241 14.997 Accounts payable 5.295 5.313 5.041 Current liabilities related to business combinations and to non-controlling interests D.18. 218 292 341 Current provisions and other current liabilities D. 19.5. 10.132 9,703 8.960 Current income tax labilities 604 258 392 Current loase abilities D.17.2. 232 261 Short-term debt and current portion of long-term debe D. 17.1. 2.767 4564 2.633 Current liabilities 19,248 20,381 17,376 Liabilities related to assets hold for sale or exchange D.A. 32 . Total equity and liabilities 114.529 112.736 (a) Includes the effects of first-time application of IFRS 16 on leases using the modified retrospective approach, effective January 1, 2019. Consolidated income statements 484 0.29. ( million) Note 2020 2019 2018 Net sales D.35.1. 36,041 36,126 34,463 Other revenues 1,328 1,505 1.214 Cost of sales (12,157) (11,976) (11,435) Gross profit 25,212 25,655 24,242 Research and development expenses (5,529) (6.018) (5.894) Selling and general expenses (9,390) (9,883) (9,859) Other operating Income D.25. 696 825 Other operating expenses D.26. (1,415) (1,207) (548) Amortization of intangible assets D.4. (1.681) (2.146) (2,170) Impairment of intangible assets D.5. (330) (3.604) (718) Fair value remeasurement of contingent consideration D.12.-D.18. 124 238 117 Restructuring costs and similar items 0.27. (1,064) (1,062) (1.480) Other gains and losses, and itigation 0.28. 136 327 502 Gain on investment arising from transaction of May 29, 2020 0.1. 7,382 Operating income 14,141 3,125 4,676 Financial expenses D.29. (390) (444) (435) Financial Income 53 141 164 Income before tax and investments accounted for using the equity method D.35.1. 13,804 2.822 4,405 Income tax expense D.30. (1.813) (139) (481) Share of profu(loss) from Investments accounted for using the equity method D.31. 359 255 499 Net Income excluding the exchanged/held for exchange Animal Health business 12,350 2,938 4,423 Net income/loss) of the exchangedheld-for-exchange Animal Health business (101) Net Income 12,350 2,837 4.410 Net Income attributable to non-controlling Interests D.32. 36 31 104 Net income attributable to equity holders of 12,314 2,806 4,300 Average number of shares outstanding (million) D.15.9. 1.253.6 1.249.9 1,247.1 Average number of shares after dilution (million) 0.15.9. 1.260.1 1,257.1 1,255.2 Basic earnings per share (in euros) 9.82 2.24 3.45 Basic earrings per share excluding the exchanged/hold-for- exchange Animal Health business (in euros) 9.82 233 3,46 Diluted earings per share (in euros) 9.77 2.23 3.43 Diluted eamings por share excluding the exchangedheld-for- exchange Animal Health business in euros) 9.77 2.31 3.44 (a) Not income fosses arising from the divestment of the Animal Health business are presented soparately in accordance with IFRS 5 (Non-Current Assets Hold for Sale and Discontinued Operations) (13) Consolidated statements of cash flows Note 2020 12.314 2019 2.806 101 31 2010 4,305 13 22 0.32 36 (339) (192) (471) 7452 (288) 4.279 (797) D.1. 3.684 (301) (6,880) (214) (542) (1.753) 58 (727) (265) 252 D.15 2.-D.15.3. -D.15.8. D.35.1. 284 274 30 (711) 3 (309) 69 7.774 (583) (134) 56 316 8.163 (547) (462) 109 421 6.827 (701) (35) 270 (814) 5.547 7.49 (2.114) 7,744 (9.816) 0.3.-04 (1.977) E million) Net income attributable to equity holders of Net (incomalous of the exchanged haid-for-exchange Animal Health business Non-controlling interests, excluding BMS Share of undistributed earnings from investments accounted for using the equity method Depreciation, amortization and impairment of property, plant and equipment, right-of- use assets and intangible assets Gains and losses on disposal of non-current assets, net of tax Gain on Regeneron Investment arising from transaction of May 29, 2020, net of tax" Net change in deferred taxes Not change in non-current provisions and other non-current liabilities Cost of employee benefits (stock options and other share-based payments) Impact of the workdown of acquired inventories remeasured at fair value Other profit or loss items with no cash effect Operating cash flow before changes in working capital and excluding the exchanged held for exchange Animal Health business Increase y decrease in inventories Encrease y decrease in accounts receivable Increase/(decrease) in accounts payable Net change in other current assets and other current abilities Net cash provided by used in) operating activities excluding the exchanged held-for-exchange Animal Health business Acquisitions of property, plant and equipment and intangible assets Acquisitions of consolidated undertakings and investments accounted for using the equity method Acquisitions of other equity investments Proceeds from disposals of property, plant and equipment, Intangible assets and other non-current assets, net of tax Net proceeds from sale of shares on May 20, 2020 Net change in other non-current assets Net cash provided by used in investing activities excluding the exchanged held for exchange Animal Health business Net cash inflow from the exchange of the Animal Health business for Br's Consumer Healthcare business Issuance of shares Dividends paid to shareholders of to non-controlling interests, excluding BMS Payments receivedlmado) on changes of ownership interest in a subsidiary without loss of control Additional long-term debt contracted Repayments of long-term debit Repayments of lease labilis Not change in short-term debt Acquisitions of treasury shares Net cash provided by used in financing activities excluding the exchanged held-or-change Animal Health business Impact of exchange rates on cash and cash equivalents Nel change in cash and cash equivalent Cash and cash equivalents, beginning of period Cash and cash equivalents, and a period D.1.-1.18 0.7. (5.338) (137) (488) (38) (12.857) (137) 918 1224 2.163 Dt. 10.370 (113) (94) (58) 3.580 (1.212) (12.866) 154 (6) 177 D.15.1. 203 (3.937 2.834) (3.773) (14) D.17.1. D.17.1. 9,677 (787) 2019 (3.952) (234) 282 (122) 1997 (2.067) (267) (154) D.17.1. 0.154 (168) (1.101) 16.405 14.193) 3,934 2.502 3.422 12915 200 10,315 1925
Step by Step Solution
There are 3 Steps involved in it

Get step-by-step solutions from verified subject matter experts