

Question: Please find attached a multi-year Income Statement (Appendix A1) and multi-year Balance Sheet (Appendix A2) for Good Dog Pet Food. This company is a (fictional)
Please find attached a multi-year Income Statement (Appendix A1) and multi-year Balance Sheet (Appendix A2) for Good Dog Pet Food. This company is a (fictional) pet food retailer that brought on a new CEO in Jan 1, 2015. You have been asked to assess whether or not Good Dog is doing well under the new CEO. Your job is to calculate and interpret important financial ratios and to make comments on how things have changed since the new CEO came on board and how the company compares to peers in the industry. Appendix A3 contains industry average information which you should find useful.
Please use the information in Appendix A1 to A3 to calculate the following ratios:
- Current ratio
- Account Receivable ratio (or days receivable)
- Accounts Payable ratio (or days payable)
- Debt ratio
- Gross Profit margin
- Operating Profit margin
- Net Profit margin
- Return on Assets
- Return on Equity
For the ROA and ROE, you should use the average total assets and the average total equity in your calculations. (The average is the total across two years divided by two). Calculate these values for each of 2014, 2015 and 2016. Interpret your calculations: what does this information mean? How is the company doing under the new CEO? (You should compare things before and after the CEO came on board). How is the company doing relative to the industry? 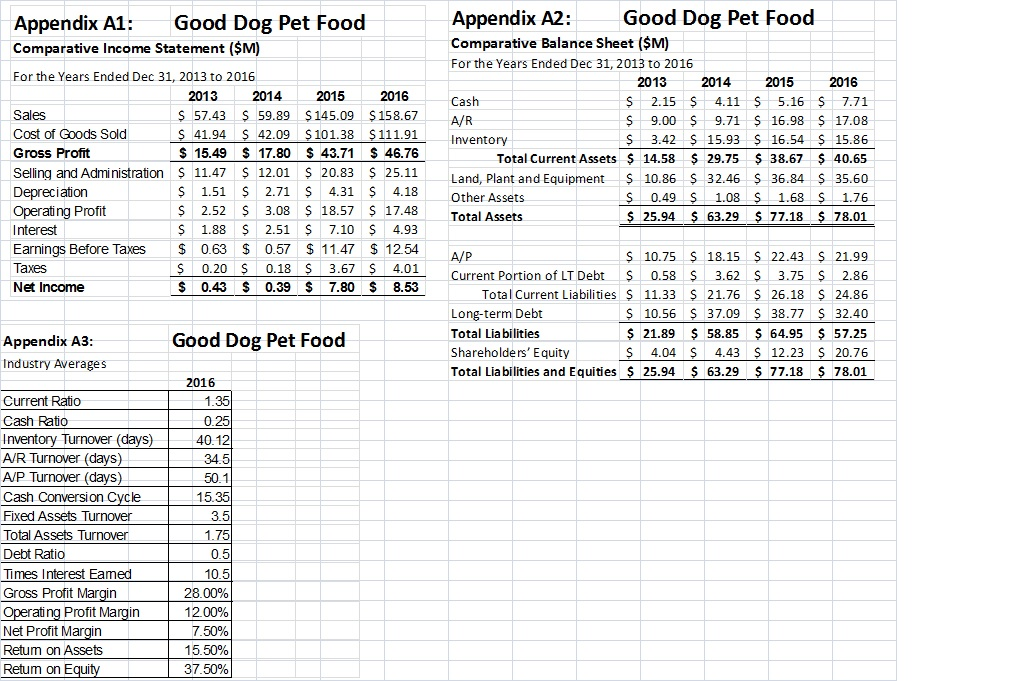
Good Dog Pet Food Appendix A2: Good Dog Pet Food Appendix A1: Comparative Balance Sheet ($M) Comparative Income Statement ($M) For the Years Ended Dec 31, 2013 to 2016 For the Years Ended Dec 31, 2013 to 2016 2013 2014 2015 2016 2013 2014 2015 2016 5.16 S 7.71 Cash 2.15 S 4.11 Sales 57.43 $ 59.89 S 42.09 $145.09 $158.67 $ 9.71 A/R 16.98 S 17.08 9.00 Cost of Goods Sold S 41.94 $101.38 $ 43.71 $111.91 $ 46.76 15.93 S 16.54 S 15.86 $ 40.65 Inventory S 3.42 15.49 $17.80 Gross Profit Total Current Assets $ 14.58 S 29.75 $ 38.67 $ 12.01 20.83 S 4.31 S 18.57 $25.11 Seling and Admi nistration S 11.47 S 1.51 S 36.84 Land, Plant and Equipment S 10.86 S 32,46 S 35.60 S 2.71 Depreciation Operating Profit 4.18 Other Assets S 0.49 S 1.08 S 1.68 S1.76 $ 3.08 S 2.51 $ 17.48 S 2.52 Total Assets $25.94 $63.29 $ 77.18 S 78.01 $ 7.10 S $ 11.47 $ 0.20 S 0.18 S3.67 4.01 0.43 0.39 7.80 8.53 4.93 Interest S 1.88 S 0.63 0.57 12.54 Earnings Before Taxes A/P S 10.75 S 18.15 S 22.43 S 3.62 S 3.75 S 21.76 26.18 S24.86 S 37.09 S 21.99 Taxes Current Portion of LT Debt Total Current Liabilities $ 11.33 S 0.58 $2.86 Net Income $ 38.77 $ 32.40 $ 57.25 $10.56 Long-term Debt $ 21.89 $ 58.85 Total Lia bilities $64.95 Good Dog Pet Food Appendix A3: $ 20.76 Shareholders' Equity S 4.04 12.23 S 4.43 Industry Averages Total Lia bilities and Equities $ 25.94 $ 63.29 $77.18 $78.01 2016 1.35 Current Rati 0.25 40.12 34.5 Cash Ratio Inventory Turnover (days) A/R Turnover (days) A/P Turnover (days) Cash Conversi on Cycle 50 1 15.35 Fixed Assets Turnover 3. Total Assets Turnover 1,75 Debt Ratio 05 Times Interest Eamed 10.5 Gross Profit Margin 28.00% Operating Profit Margin Net Profit Margin 12.00% .50% Retum on Assets 15.50% Retum on Equity 37.50% Good Dog Pet Food Appendix A2: Good Dog Pet Food Appendix A1: Comparative Balance Sheet ($M) Comparative Income Statement ($M) For the Years Ended Dec 31, 2013 to 2016 For the Years Ended Dec 31, 2013 to 2016 2013 2014 2015 2016 2013 2014 2015 2016 5.16 S 7.71 Cash 2.15 S 4.11 Sales 57.43 $ 59.89 S 42.09 $145.09 $158.67 $ 9.71 A/R 16.98 S 17.08 9.00 Cost of Goods Sold S 41.94 $101.38 $ 43.71 $111.91 $ 46.76 15.93 S 16.54 S 15.86 $ 40.65 Inventory S 3.42 15.49 $17.80 Gross Profit Total Current Assets $ 14.58 S 29.75 $ 38.67 $ 12.01 20.83 S 4.31 S 18.57 $25.11 Seling and Admi nistration S 11.47 S 1.51 S 36.84 Land, Plant and Equipment S 10.86 S 32,46 S 35.60 S 2.71 Depreciation Operating Profit 4.18 Other Assets S 0.49 S 1.08 S 1.68 S1.76 $ 3.08 S 2.51 $ 17.48 S 2.52 Total Assets $25.94 $63.29 $ 77.18 S 78.01 $ 7.10 S $ 11.47 $ 0.20 S 0.18 S3.67 4.01 0.43 0.39 7.80 8.53 4.93 Interest S 1.88 S 0.63 0.57 12.54 Earnings Before Taxes A/P S 10.75 S 18.15 S 22.43 S 3.62 S 3.75 S 21.76 26.18 S24.86 S 37.09 S 21.99 Taxes Current Portion of LT Debt Total Current Liabilities $ 11.33 S 0.58 $2.86 Net Income $ 38.77 $ 32.40 $ 57.25 $10.56 Long-term Debt $ 21.89 $ 58.85 Total Lia bilities $64.95 Good Dog Pet Food Appendix A3: $ 20.76 Shareholders' Equity S 4.04 12.23 S 4.43 Industry Averages Total Lia bilities and Equities $ 25.94 $ 63.29 $77.18 $78.01 2016 1.35 Current Rati 0.25 40.12 34.5 Cash Ratio Inventory Turnover (days) A/R Turnover (days) A/P Turnover (days) Cash Conversi on Cycle 50 1 15.35 Fixed Assets Turnover 3. Total Assets Turnover 1,75 Debt Ratio 05 Times Interest Eamed 10.5 Gross Profit Margin 28.00% Operating Profit Margin Net Profit Margin 12.00% .50% Retum on Assets 15.50% Retum on Equity 37.50%
Step by Step Solution
There are 3 Steps involved in it

Get step-by-step solutions from verified subject matter experts