

Question: Please find the below-mentioned data for making DCF, FCFF, and FCFE models in excel. Take the industry average12% for electrical equipment currently going on in
Please find the below-mentioned data for making DCF, FCFF, and FCFE models in excel. Take the industry average12% for electrical equipment currently going on in the market, also predict the same for next 10 yrs.
Also, carry out fundamental analysis along with the ratios analysis.
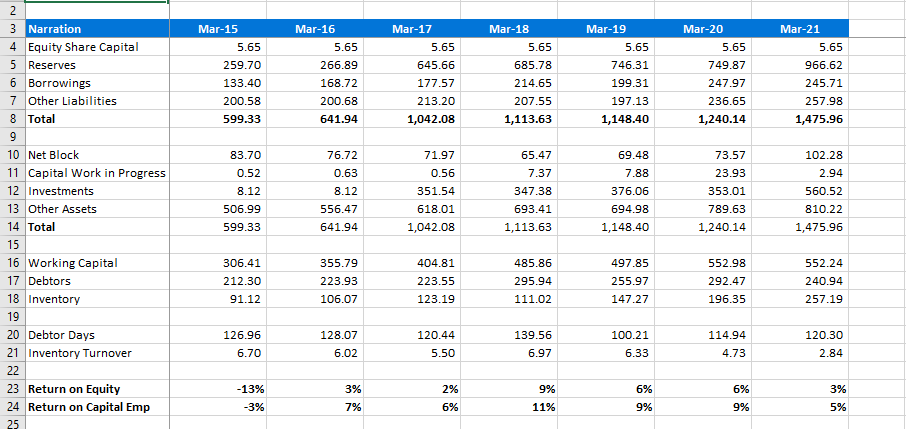
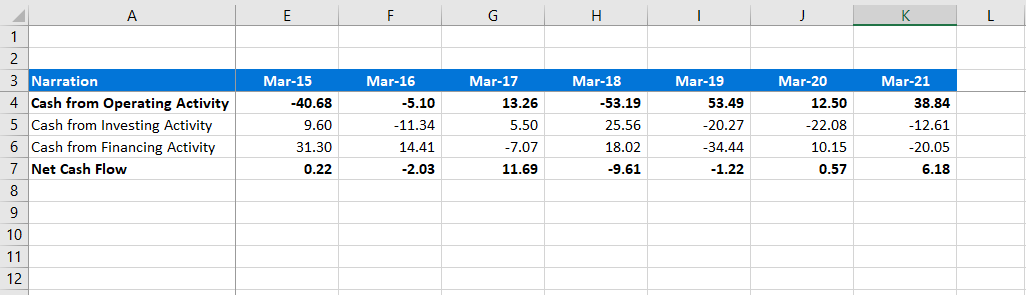
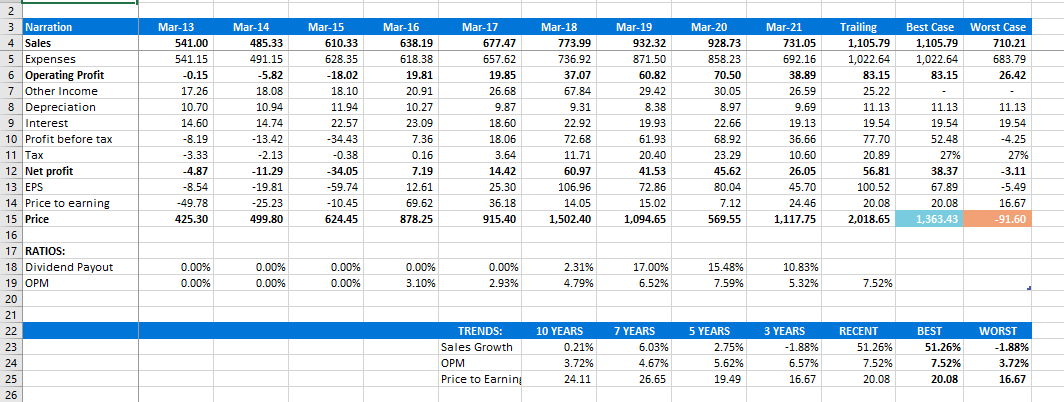
Mar-15 5.65 Mar-16 5.65 266.89 Mar-17 5.65 Mar-18 5.65 Mar-19 5.65 Mar-20 5.65 259.70 133.40 200.58 645.66 177.57 213.20 1,042.08 168.72 685.78 214.65 207.55 1,113.63 746.31 199.31 197.13 1,148.40 Mar-21 5.65 966.62 245.71 257.98 749.87 247.97 236.65 1,240.14 200.68 641.94 599.33 1,475.96 83.70 0.52 65.47 7.37 8.12 76.72 0.63 8.12 556.47 641.94 2 3 Narration 4 Equity Share Capital 5 Reserves 6 Borrowings 7 Other Liabilities 8 Total 9 10 Net Block 11 Capital Work in Progress 12 Investments 13 Other Assets 14 Total 15 16 Working Capital 17 Debtors 18 Inventory 19 20 Debtor Days 21 Inventory Turnover 22 23 Return on Equity 24 Return on Capital Emp 25 71.97 0.56 351.54 618.01 1,042.08 73.57 23.93 353.01 347.38 69.48 7.88 376.06 694.98 1,148.40 102.28 2.94 560.52 810.22 1,475.96 506.99 599.33 693.41 1,113.63 789.63 1,240.14 306.41 212.30 91.12 355.79 223.93 106.07 404.81 223.55 123.19 485.86 295.94 111.02 497.85 255.97 147.27 552.98 292.47 196.35 552.24 240.94 257.19 126.96 6.70 128.07 6.02 120.44 5.50 139.56 6.97 100.21 6.33 114.94 4.73 120.30 2.84 3% 2% 9% 6% 3% -13% -3% 6% 9% 7% 6% 11% 9% 5% A F G H L 1 Mar-17 13.26 2 3 Narration 4 Cash from Operating Activity 5 Cash from Investing Activity 6 Cash from Financing Activity 7 Net Cash Flow Mar-15 -40.68 9.60 31.30 0.22 Mar-16 -5.10 -11.34 14.41 -2.03 5.50 -7.07 11.69 Mar-18 -53.19 25.56 18.02 -9.61 Mar-19 53.49 -20.27 -34.44 -1.22 Mar-20 12.50 -22.08 10.15 0.57 Mar-21 38.84 -12.61 -20.05 6.18 8 9 10 11 12 Best Case 1,105.79 1,022.64 83.15 Worst Case 710.21 683.79 26.42 Mar-13 541.00 541.15 -0.15 17.26 10.70 w 14.60 -8.19 -3.33 -4.87 -8.54 -49.78 425.30 Mar-14 485.33 491.15 -5.82 18.08 100 10.94 14.74 -13.42 240 -2.13 -11.29 -19.81 -25.23 499.80 2 3 Narration 4 Sales 5 Expenses 6 Operating Profit 7 Other Income 8 Depreciation 9 Interest e tits 10 Profit before tax 11 Tax 12 Net profit 13 EPS 14 Price to earning 15 Price 4 16 17 RATIOS: 18 Dividend Payout 10 19 OPM 20 21 22 23 24 25 26 Mar-15 610.33 628.35 -18.02 18.10 11.94 22.57 200 -34.43 -0.38 - -34.05 -59.74 -10.45 624.45 Mar-16 638.19 618.38 19.81 20.91 10 10.27 23.09 200 7.36 0.16 7.19 12.61 69.62 878.25 Mar-17 677.47 657.62 19.85 26.68 9.87 18.60 18.06 3.64 14.42 25.30 36.18 915.40 Mar-18 773.99 736.92 37.07 67.84 9.31 22.92 72.68 11.71 60.97 4000 106.96 14.05 1,502.40 Mar-19 932.32 871.50 60.82 29.42 8.38 . 19.93 61.93 20.40 41.53 72.86 15.02 1,094.65 Mar-20 928.73 858.23 70.50 200 30.05 8.97 22.66 68.92 23.29 45.62 80.04 7.12 569.55 Mar-21 731.05 692.16 38.89 26.59 9.69 19.13 36.66 10.60 ror 26.05 45.70 A 20 24.46 1,117.75 Trailing 1,105.79 1,022.64 83.15 25.22 11.13 19.54 77.70 20.89 Pro 56.81 100.52 20.08 2,018.65 4440 11.13 40 19.54 20 52.48 27% 38.37 67.89 20.08 1,363.43 11.13 19.54 -4.25 27% 249 -3.11 -5.49 16.67 -91.60 0.00% 0.00% 0.00% 0.00% 0.00% 0.00% 0.00% 3.10% 0.00% 2.93% 2.31% 4.79% 17.00% 6.52% 15.48% 7.59% 10.83% 5.32% 7.52% TRENDS: Sales Growth OPM Price to Earnini 10 YEARS 0.21% 3.72% 24.11 7 YEARS 6.03% 4.67% 26.65 5 YEARS 2.75% 5.62% 19.49 3 YEARS -1.88% 6.57% 16.67 RECENT 51.26% 7.52% % 20.08 BEST 51.26% 7.52% 20.08 WORST -1.88% 3.72% 16.67 Mar-15 5.65 Mar-16 5.65 266.89 Mar-17 5.65 Mar-18 5.65 Mar-19 5.65 Mar-20 5.65 259.70 133.40 200.58 645.66 177.57 213.20 1,042.08 168.72 685.78 214.65 207.55 1,113.63 746.31 199.31 197.13 1,148.40 Mar-21 5.65 966.62 245.71 257.98 749.87 247.97 236.65 1,240.14 200.68 641.94 599.33 1,475.96 83.70 0.52 65.47 7.37 8.12 76.72 0.63 8.12 556.47 641.94 2 3 Narration 4 Equity Share Capital 5 Reserves 6 Borrowings 7 Other Liabilities 8 Total 9 10 Net Block 11 Capital Work in Progress 12 Investments 13 Other Assets 14 Total 15 16 Working Capital 17 Debtors 18 Inventory 19 20 Debtor Days 21 Inventory Turnover 22 23 Return on Equity 24 Return on Capital Emp 25 71.97 0.56 351.54 618.01 1,042.08 73.57 23.93 353.01 347.38 69.48 7.88 376.06 694.98 1,148.40 102.28 2.94 560.52 810.22 1,475.96 506.99 599.33 693.41 1,113.63 789.63 1,240.14 306.41 212.30 91.12 355.79 223.93 106.07 404.81 223.55 123.19 485.86 295.94 111.02 497.85 255.97 147.27 552.98 292.47 196.35 552.24 240.94 257.19 126.96 6.70 128.07 6.02 120.44 5.50 139.56 6.97 100.21 6.33 114.94 4.73 120.30 2.84 3% 2% 9% 6% 3% -13% -3% 6% 9% 7% 6% 11% 9% 5% A F G H L 1 Mar-17 13.26 2 3 Narration 4 Cash from Operating Activity 5 Cash from Investing Activity 6 Cash from Financing Activity 7 Net Cash Flow Mar-15 -40.68 9.60 31.30 0.22 Mar-16 -5.10 -11.34 14.41 -2.03 5.50 -7.07 11.69 Mar-18 -53.19 25.56 18.02 -9.61 Mar-19 53.49 -20.27 -34.44 -1.22 Mar-20 12.50 -22.08 10.15 0.57 Mar-21 38.84 -12.61 -20.05 6.18 8 9 10 11 12 Best Case 1,105.79 1,022.64 83.15 Worst Case 710.21 683.79 26.42 Mar-13 541.00 541.15 -0.15 17.26 10.70 w 14.60 -8.19 -3.33 -4.87 -8.54 -49.78 425.30 Mar-14 485.33 491.15 -5.82 18.08 100 10.94 14.74 -13.42 240 -2.13 -11.29 -19.81 -25.23 499.80 2 3 Narration 4 Sales 5 Expenses 6 Operating Profit 7 Other Income 8 Depreciation 9 Interest e tits 10 Profit before tax 11 Tax 12 Net profit 13 EPS 14 Price to earning 15 Price 4 16 17 RATIOS: 18 Dividend Payout 10 19 OPM 20 21 22 23 24 25 26 Mar-15 610.33 628.35 -18.02 18.10 11.94 22.57 200 -34.43 -0.38 - -34.05 -59.74 -10.45 624.45 Mar-16 638.19 618.38 19.81 20.91 10 10.27 23.09 200 7.36 0.16 7.19 12.61 69.62 878.25 Mar-17 677.47 657.62 19.85 26.68 9.87 18.60 18.06 3.64 14.42 25.30 36.18 915.40 Mar-18 773.99 736.92 37.07 67.84 9.31 22.92 72.68 11.71 60.97 4000 106.96 14.05 1,502.40 Mar-19 932.32 871.50 60.82 29.42 8.38 . 19.93 61.93 20.40 41.53 72.86 15.02 1,094.65 Mar-20 928.73 858.23 70.50 200 30.05 8.97 22.66 68.92 23.29 45.62 80.04 7.12 569.55 Mar-21 731.05 692.16 38.89 26.59 9.69 19.13 36.66 10.60 ror 26.05 45.70 A 20 24.46 1,117.75 Trailing 1,105.79 1,022.64 83.15 25.22 11.13 19.54 77.70 20.89 Pro 56.81 100.52 20.08 2,018.65 4440 11.13 40 19.54 20 52.48 27% 38.37 67.89 20.08 1,363.43 11.13 19.54 -4.25 27% 249 -3.11 -5.49 16.67 -91.60 0.00% 0.00% 0.00% 0.00% 0.00% 0.00% 0.00% 3.10% 0.00% 2.93% 2.31% 4.79% 17.00% 6.52% 15.48% 7.59% 10.83% 5.32% 7.52% TRENDS: Sales Growth OPM Price to Earnini 10 YEARS 0.21% 3.72% 24.11 7 YEARS 6.03% 4.67% 26.65 5 YEARS 2.75% 5.62% 19.49 3 YEARS -1.88% 6.57% 16.67 RECENT 51.26% 7.52% % 20.08 BEST 51.26% 7.52% 20.08 WORST -1.88% 3.72% 16.67
Step by Step Solution
There are 3 Steps involved in it

Get step-by-step solutions from verified subject matter experts